

In the current business climate, where every dollar spent needs to be justified, proving return on investment (ROI) for your internal training programs is more important than ever. It’s not enough to show that your program is helping employees learn new skills; you need to prove that it’s having a positive effect on the company’s bottom line.
At a basic level, this formula is the simplest way to calculate ROI:
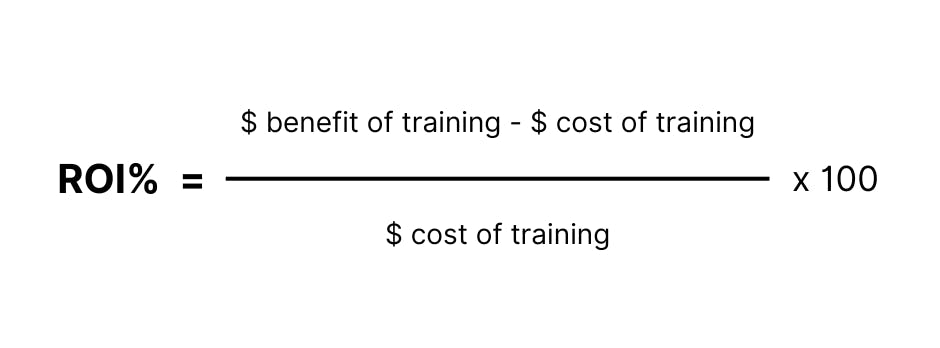
This equation is a good start, but how do you put a dollar amount on a training program whose effects seem largely unquantifiable?
We want to help. We’re going to walk you through three of the most widely used frameworks for evaluating the impact of your training programs. Using one of these models, or a combination of all three, will equip you to prove your program’s value to the people who control the purse strings.
Don't forget to try out our free training ROI calculator to help you demonstrate the monetary benefits of your programs.

Measure your training ROI 🧮
By providing your contact info, you agree to receive communications from 360Learning. You can opt-out at any time. For details, refer to our Privacy Policy.
1. The Kirkpatrick Model of training evaluation
The Kirkpatrick Model is one of the most commonly used methodologies for evaluating the effectiveness of training programs. You can use it to connect numerical indicators of ROI, like sales numbers or retention rates, directly back to the skills learned during employee training.
It’s not enough to simply tell your superiors that training led to higher employee engagement in the sales process (and, thus, higher sales). You need the data to back you up. The Kirkpatrick Model lets you create a chain of evidence—a path that shows exactly how the training you instituted led to an increase in sales volume.
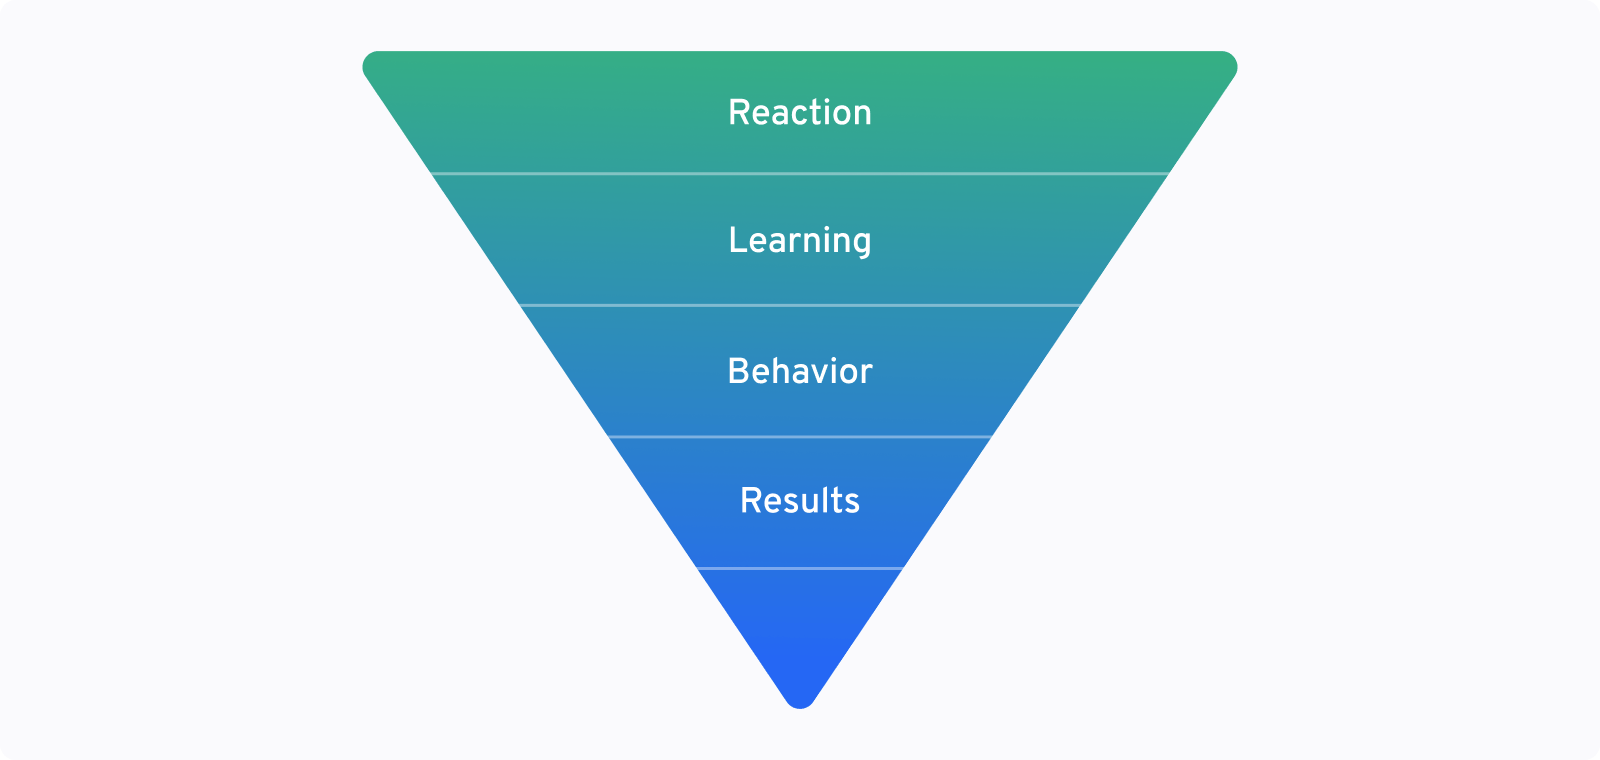
The model uses four steps or levels of analysis to trace how learning leads to actionable results. Collect data at each of these points:
- Level 1: Reaction —Immediately after training, gauge employee’s reactions. Survey the employees after training to gauge their immediate reactions: How did they feel about training? Did they find the material useful? Was it presented in a clear and helpful way?
- Level 2: Learning — Assess how much employees retained from the training course. Test them on their knowledge, or have them complete demonstrations or assignments that you can evaluate.
- Level 3: Behavior — Learning on its own is nice, but we want to know whether employees are applying that knowledge to their work. Are they using their new skills on the job? Find out using spot inspections, manager evaluations, or even self-assessments.
- Level 4: Results — Finally, on the most macro level, what did this change in behavior result in? How did it help the company? This is where we pinpoint the most tangible effects of the training. Look at factors like increased sales numbers, changes in employee retention, or elevated production levels.
Before you begin training, use the Kirkpatrick Model to map out the business result you hope to see from your training program. It might sound odd, but we recommend you start at Level 4, then work backward to identify the steps that would be required to get there.
Here’s what we mean. Say you have a sales training program designed to help call center employees increase their average order value (aka upsell customers). To prove ROI, you’ll want to start by mapping out your call center analytics and KPIs, then evaluate the program like this:
- Level 4: For us, success would look like an increase in average order size per call. This is our results metric.
- Level 3: What behavior would have to happen to lead to that result? We would have to prove that salespeople were putting their training into use on their calls. We decide to use call recording and analysis software to measure whether employees are using key phrases and techniques they learned in training.
- Level 2: To measure what employees learned during training, we decide to give them a test at the end of training. That way, we can prove they picked up these new techniques from the training and not somewhere else.
- Level 1: Finally, we want to gauge employee’s personal reactions to the training to see whether they felt it was a good use of their time.
A collaborative learning platform like 360Learning encourages employees to give instant feedback, making it easy to gauge their responses. If you don’t have those capabilities, a survey would also suffice, but make sure to poll participants immediately after course completion.
Now you’re ready to move forward with your training program, collecting the relevant data as you go. Later, when you discover that since the training cart sizes have increased by an average of 10%, you can use the data you’ve collected to clearly show that the sales training was directly responsible.
2. The Phillips Model of learning evaluation
A major shortcoming of the Kirkpatrick Model is that it stops just short of providing a true training ROI cost-benefit analysis. You can show that the training produced measurable results, but how does that stack up against the costs of running the program? To fix that, we can look to the Phillips Model, which builds on Kirkpatrick’s framework with a fifth level: ROI.
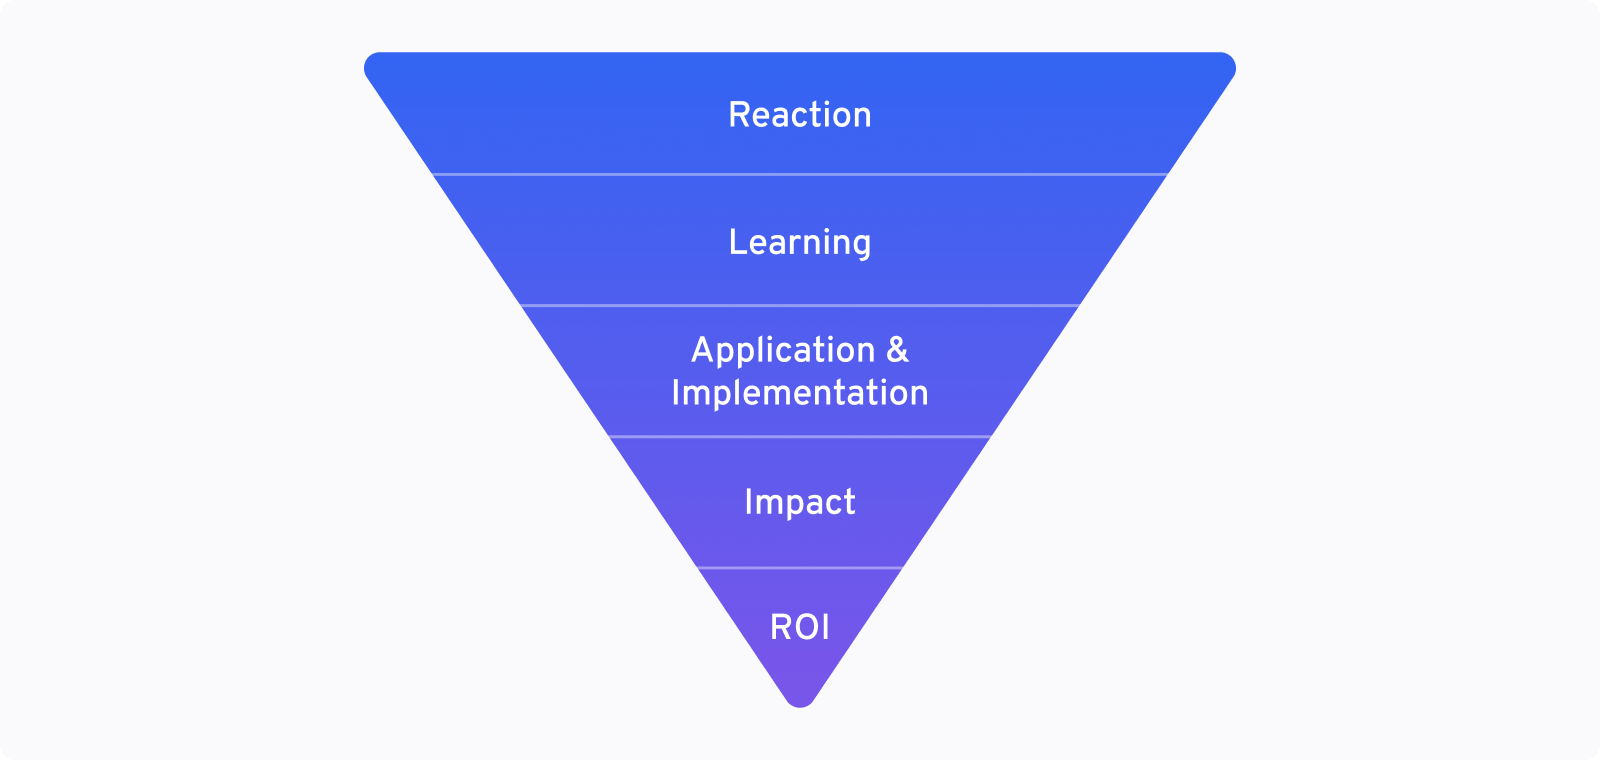
The five levels of the Phillips Model are based on Kirkpatrick’s Model, with a few tweaks meant to create more data, and context around that data, to ultimately help determine ROI.
- Level 1: Reaction — Like the Kirkpatrick Model, you gauge your employees’ reactions to their training experience.
- Level 2: Learning — Like the Kirkpatrick Model, you assess whether employees’ retained the knowledge they received during training.
- Level 3: Application and Implementation — Instead of just identifying a change in behavior, the Philips Model accounts for factors outside of training that might help or hinder progress.
For example, maybe employees started using the new sales techniques, but the organization pivoted from phone sales to in-person sales. Level 3 in the Kirkpatrick Model would just say the learning was not implemented, but the Phillips Model gives you space to explain why. - Level 4: Impact — Impact is a more holistic measure than the Results level of the Kirkpatrick Model because it takes into account both the positive and the negative business impacts of training. Here you’ll assemble all the net benefits caused by training, as well as all the costs associated with it.
- Level 5: ROI — Finally, how does impact translate financially? In this step, you’ll do a cost-benefit analysis to determine the ultimate value of the training program. You’ll compile all of the financial impacts and all of the potential training costs to discover its true financial benefit.
To calculate training ROI, you would collect the data for levels 1-4, creating your chain of evidence, just like in the Kirkpatrick Model. The only major difference is that instead of calculating one number for Level 4, you would attempt to capture impact figures for a variety of metrics and would convert them into a monetary value.
So, for our sales training example from the first section, let’s say we were able to connect our training program with a 10% increase in average order value across the company, translating to an $80,000 increase in sales over the next year.
How much did it cost to run the training? Let’s run the numbers:
- Resource Development Costs — How much it costs to create and implement the course, including the price of an LMS. In this case, let’s say we spent $10,000 on developing our course.
- Time Spent — The time employees spend completing training. In this case, we trained 100 employees, who each make $25 an hour, and that training took three hours. Total: $7,500
- Implementation Costs — Other costs to run the course—for example, technical support, equipment, or space rental. However, our course was run online, and we didn’t need to hire additional tech support, so our implementation costs were $0.
So, in this scenario, our total cost of training was $17,500, and our total benefit was $80,000.
From there, we can plug the numbers into the equation we discussed at the beginning of the article:
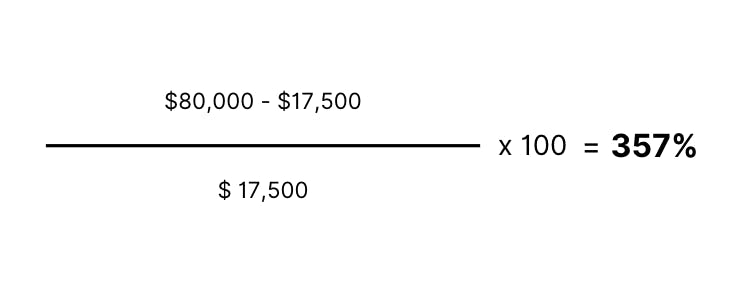
So, our ROI is 357%. A pretty impressive number that shows we got a healthy return on the money we spent.
Remember that when it comes to calculating ROI, timing is everything. Don’t wait until the program is completed to start calculations, or you may find that your ROI is smaller than expected or nonexistent.
Instead, do the math at intervals throughout the training process, so you can adjust training or implementation to make sure you’re getting the maximum value.
When it comes to calculating ROI, timing is everything. Don’t wait until the program is completed to start calculations, or you may find that your ROI is smaller than expected or nonexistent.
3. Brinkerhoff's Success Case Method
“Data backed” success doesn’t always equate to hard numbers. While the two methods above focus on gathering quantitative data that proves learning effectiveness, Brinkerhoff’s Success Case Method aims to gather qualitative evidence.
This method is perhaps most on-trend with the state of L&D today. LinkedIn Learning’s 2022 Workplace Learning Report shows that qualitative feedback from employees is the most effective method for workplaces to properly evaluate their programs.
Brinkerhoff’s Method focuses less on proof of learning and more on the actual impact of education, so you don’t have to spend so much time compiling statistics and tying actions to outcomes. Instead of calculating a dollar value for training, you’ll create compelling examples and case studies to help sway decision-makers toward favoring your programs.
Here’s how the Success Case Method works:
- Identify training goals and expectations — What results do you hope to see as a result of the training experience? What does success look like?
- Identify outliers — Survey or evaluate training participants to identify those who have done the best job of meeting expectations and those who have done the worst.
- Research — Conduct in-depth interviews with individuals from both groups to document the impact of this specific training on their work and to identify what factors made the course successful or unsuccessful for them.
- Document your results — Use your findings to create two kinds of deliverables: case studies that profile the most compelling success stories, and a report that showcases the strengths and failures of the training program and where you can potentially improve.
So, to evaluate our sales training, we would start by picking our goal metric. Let’s stick with our example of average order size per call.
While the average increase in cart size was 10%, five salespeople went above and beyond and boosted their numbers by upward of 20%. There were also five salespeople who showed no improvement or even showed a drop in sales figures over that period.
So we sit down and hash it out with both sets of people. We ask everyone the same three questions:
- What are your thoughts on the training?
- What worked and what didn’t?
- How has the training affected your behavior?
From the top performers, we learn what they found most effective about the sales training and how it helped boost their performance. We come away with some impressive first-hand stories on how useful the training was.
From the poor performers, we learn that they were confused by some of the sales techniques or that they are implementing those techniques incorrectly. From that, we take away some concrete ideas to improve the program next time around. We pair that knowledge with analytics data pulled directly from the training program to see exactly where users struggled during training.
Putting all of that information together, we can tell a persuasive story of how our training is instilling confidence and knowledge in our top salespeople, as well as provide some concrete ideas on how to make our next round of training even more effective. When presented with confidence, these stories can be just as persuasive as numbers in a spreadsheet.
Related: 3 Essential Tips to Create Engaging Training for Your Sales teams
Brinkerhoff’s Method focuses less on proof of learning and more on the actual impact of education, so you don’t have to spend so much time compiling statistics and tying actions to outcomes.
Try our training ROI calculator
Still not sure how to best demonstrate the monetary benefits of quality training at your organization? We’ve developed our very own ROI calculator to help your L&D team forecast potential ROI.
Simply plug in your numbers, and we’ll do the math for you. We use this calculator internally, but for the first time, we’re making it available for anyone to use to calculate the impact of your training in various use cases, including:
- Onboarding
- Sales enablement/training
- Retail training
- Digitized in-person training
- Training for the manufacturing industry
- SaaS client training
Our ROI calculator is closely related to Level 5 of the Phillips Model of Evaluation in that it will help you calculate a dollar-based ROI number. You can then use any of these three models to tie those numbers back to your learning initiatives.
Additionally, if you use Salesforce, 360Learning has an integration that can help you measure ROI by drawing direct correlations between training and employee performance data, such as revenue or service tickets.
Measure your training ROI 🧮
By providing your contact info, you agree to receive communications from 360Learning. You can opt-out at any time. For details, refer to our Privacy Policy.
Make a plan to stay on top of tracking ROI
Which of these three methods is the most effective? That depends on your organization and the kind of data your stakeholders (aka your decision-makers) respond to best.
Some may find a personal narrative more compelling, whereas others require hard data to fuel their decisions. In most cases, a combination of both qualitative and quantitative data will be most persuasive.
When it comes to demonstrating ROI, it’s important to be proactive. By the time higher-ups are asking to see numbers, your program may already be on the chopping block.
Whatever method you choose, be sure to evaluate the effectiveness of your programs constantly. That way, you can show value at the drop of a hat, maintain company buy-in, and keep your programs running.
 Our weekly newsletter of the best insights from L&D peer to L&D peer.
By providing your contact info, you agree to receive communications from 360Learning. You can opt-out at any time. For details, refer to our Privacy Policy.