

"Only when L&D connects both ends—learning needs and impact—to everyday work and business goals can we create a learning system that is rooted in the reality of the organization and whose impact can be felt where it matters most: in the work itself."
— Jan Foelsing, New Learning Expert & Co-Founder, New Learning Lab
Finding four: Breaking out of Level 2 into Level 3 is a strategy and alignment problem
Learning Needs Identification is the single most commonly cited weakness in the entire dataset. Its average score across the full sample is 2.37 — the second-lowest of all seven themes — but it is named as the single weakest dimension by 52% of respondents, the highest rate of any dimension we measured. Learning Metrics is a close second at 46% (its own wall, covered in the next section), followed by Learner Engagement at 40%, with Learning Strategy and SME Collaboration named as the weak point by only 33% and 31% of respondents respectively.
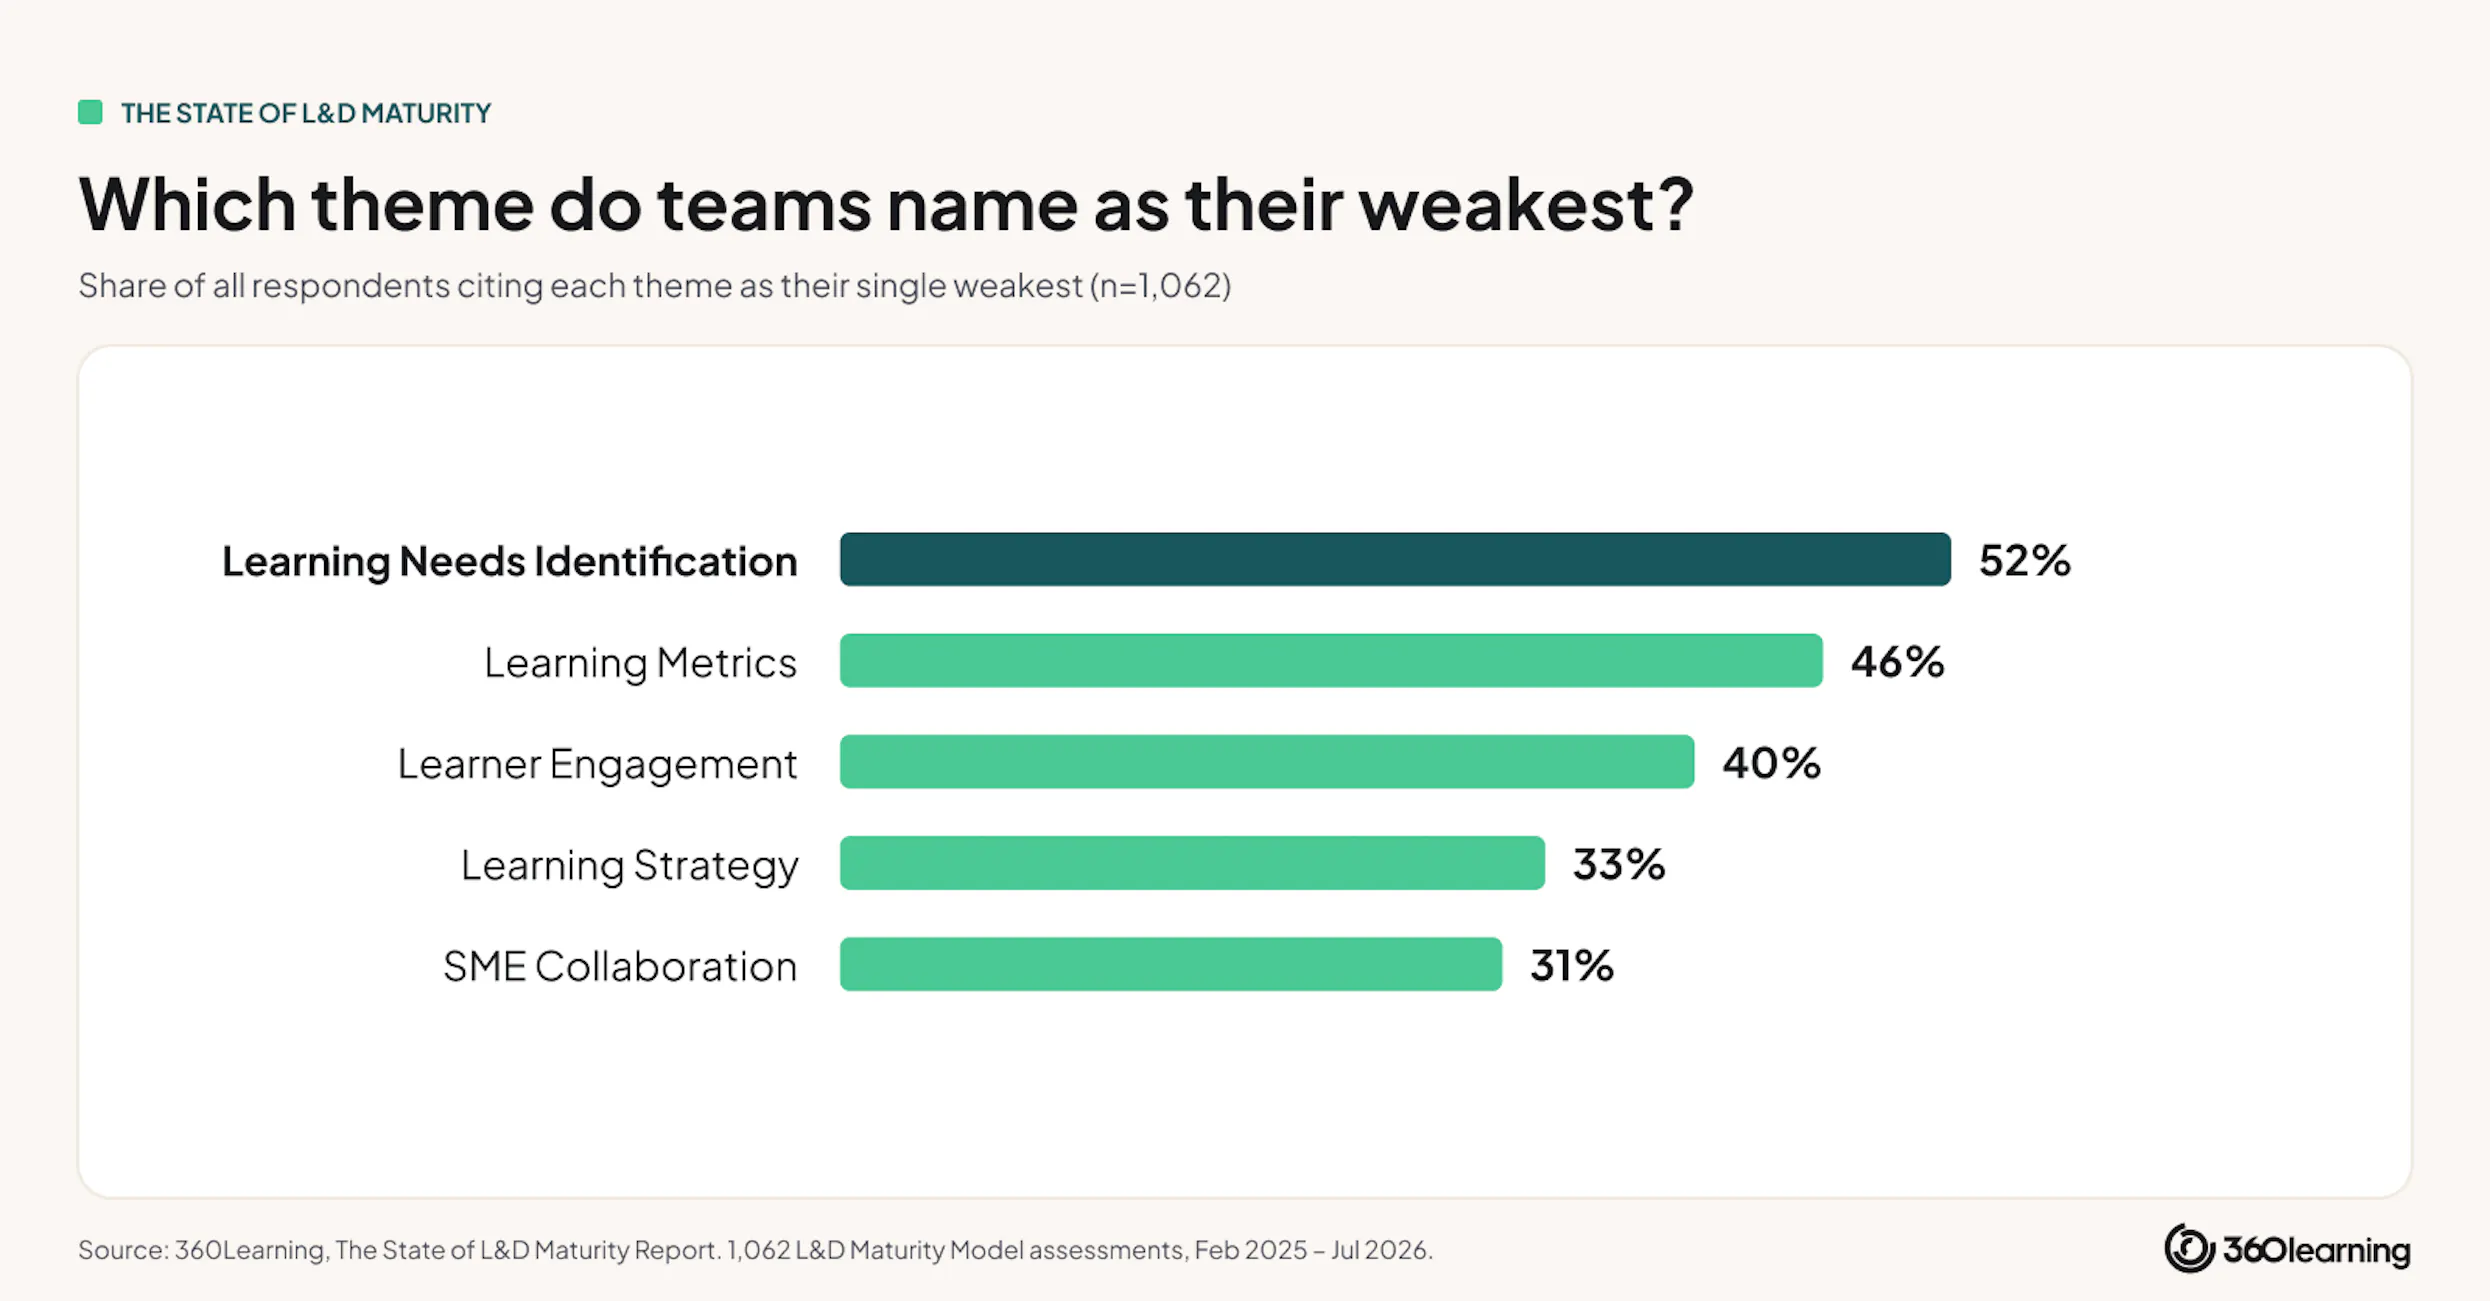
That pattern says something about where L&D teams struggle. They're relatively good at setting a strategy and building leadership buy-in for it — those are the two themes least likely to be anyone's weak point. Where they fall down is more fundamental: systematically figuring out what the organization needs to learn, as opposed to what it's always trained on. That's the gap between having a mandate — "upskill the workforce" — and having a method: here's what problem to solve, who to solve it for, and why.
Nowhere is this gap sharper than in compliance-heavy sectors. Among our banking and healthcare respondents (n=71), Learning Needs Identification comes in at 2.18 against a global average of 2.37 — a 0.19-level shortfall that is the single largest sector-level deviation on any dimension in the dataset, even though these sectors are close to average everywhere else. The explanation is almost structural: in regulated industries, compliance mandates define the training agenda for you. There's no needs-identification muscle required when a regulator has already told you what to train.
The trap is that teams in these sectors get so accustomed to compliance-driven training that they ask "what else should our people be learning?" — and that capability is exactly what's needed to move past compliance once the regulatory boxes are ticked.
Finding five: Breaking out of Level 3 into Level 4 is a quantifying impact problem
Learning Metrics is the lowest-scoring of all seven themes, averaging 2.36 across the full sample. Nearly half of all respondents, 48%, sit at exactly Level 2 on it, the single largest concentration of any dimension at any level in the whole dataset. Only 11% reach Level 4 or 5.
This isn't a junior-practitioner blind spot. Among our — admittedly small, n=18 — sample of C-Level respondents, the self-rated score for Learning Metrics is 2.17, lower than any other seniority level gives itself on any dimension.
This isn't a junior-practitioner blind spot. Among our — admittedly small, n=18 — sample of C-Level respondents, the self-rated score for Learning Metrics is 2.17, lower than any other seniority level gives itself on any theme.
The same executives rate Leadership Alignment 0.49 levels higher than Managers and ICs do (3.11 versus 2.62), so the picture that emerges is executives who feel reasonably well aligned with the business, but who are even more clear-eyed than their teams about the fact that they can't yet prove what learning is delivering. We treat this finding as a callout rather than a headline, given the small sample, but it's a striking piece of internal corroboration for the wider quantifying impact story.
That wider story is the most consequential number in this report. When we split the full sample by their Learning Metrics score and compare everything else, the Level 1–2 group averages 2.21 overall, while the Level 4–5 group averages 3.62 , 1.41 levels higher.
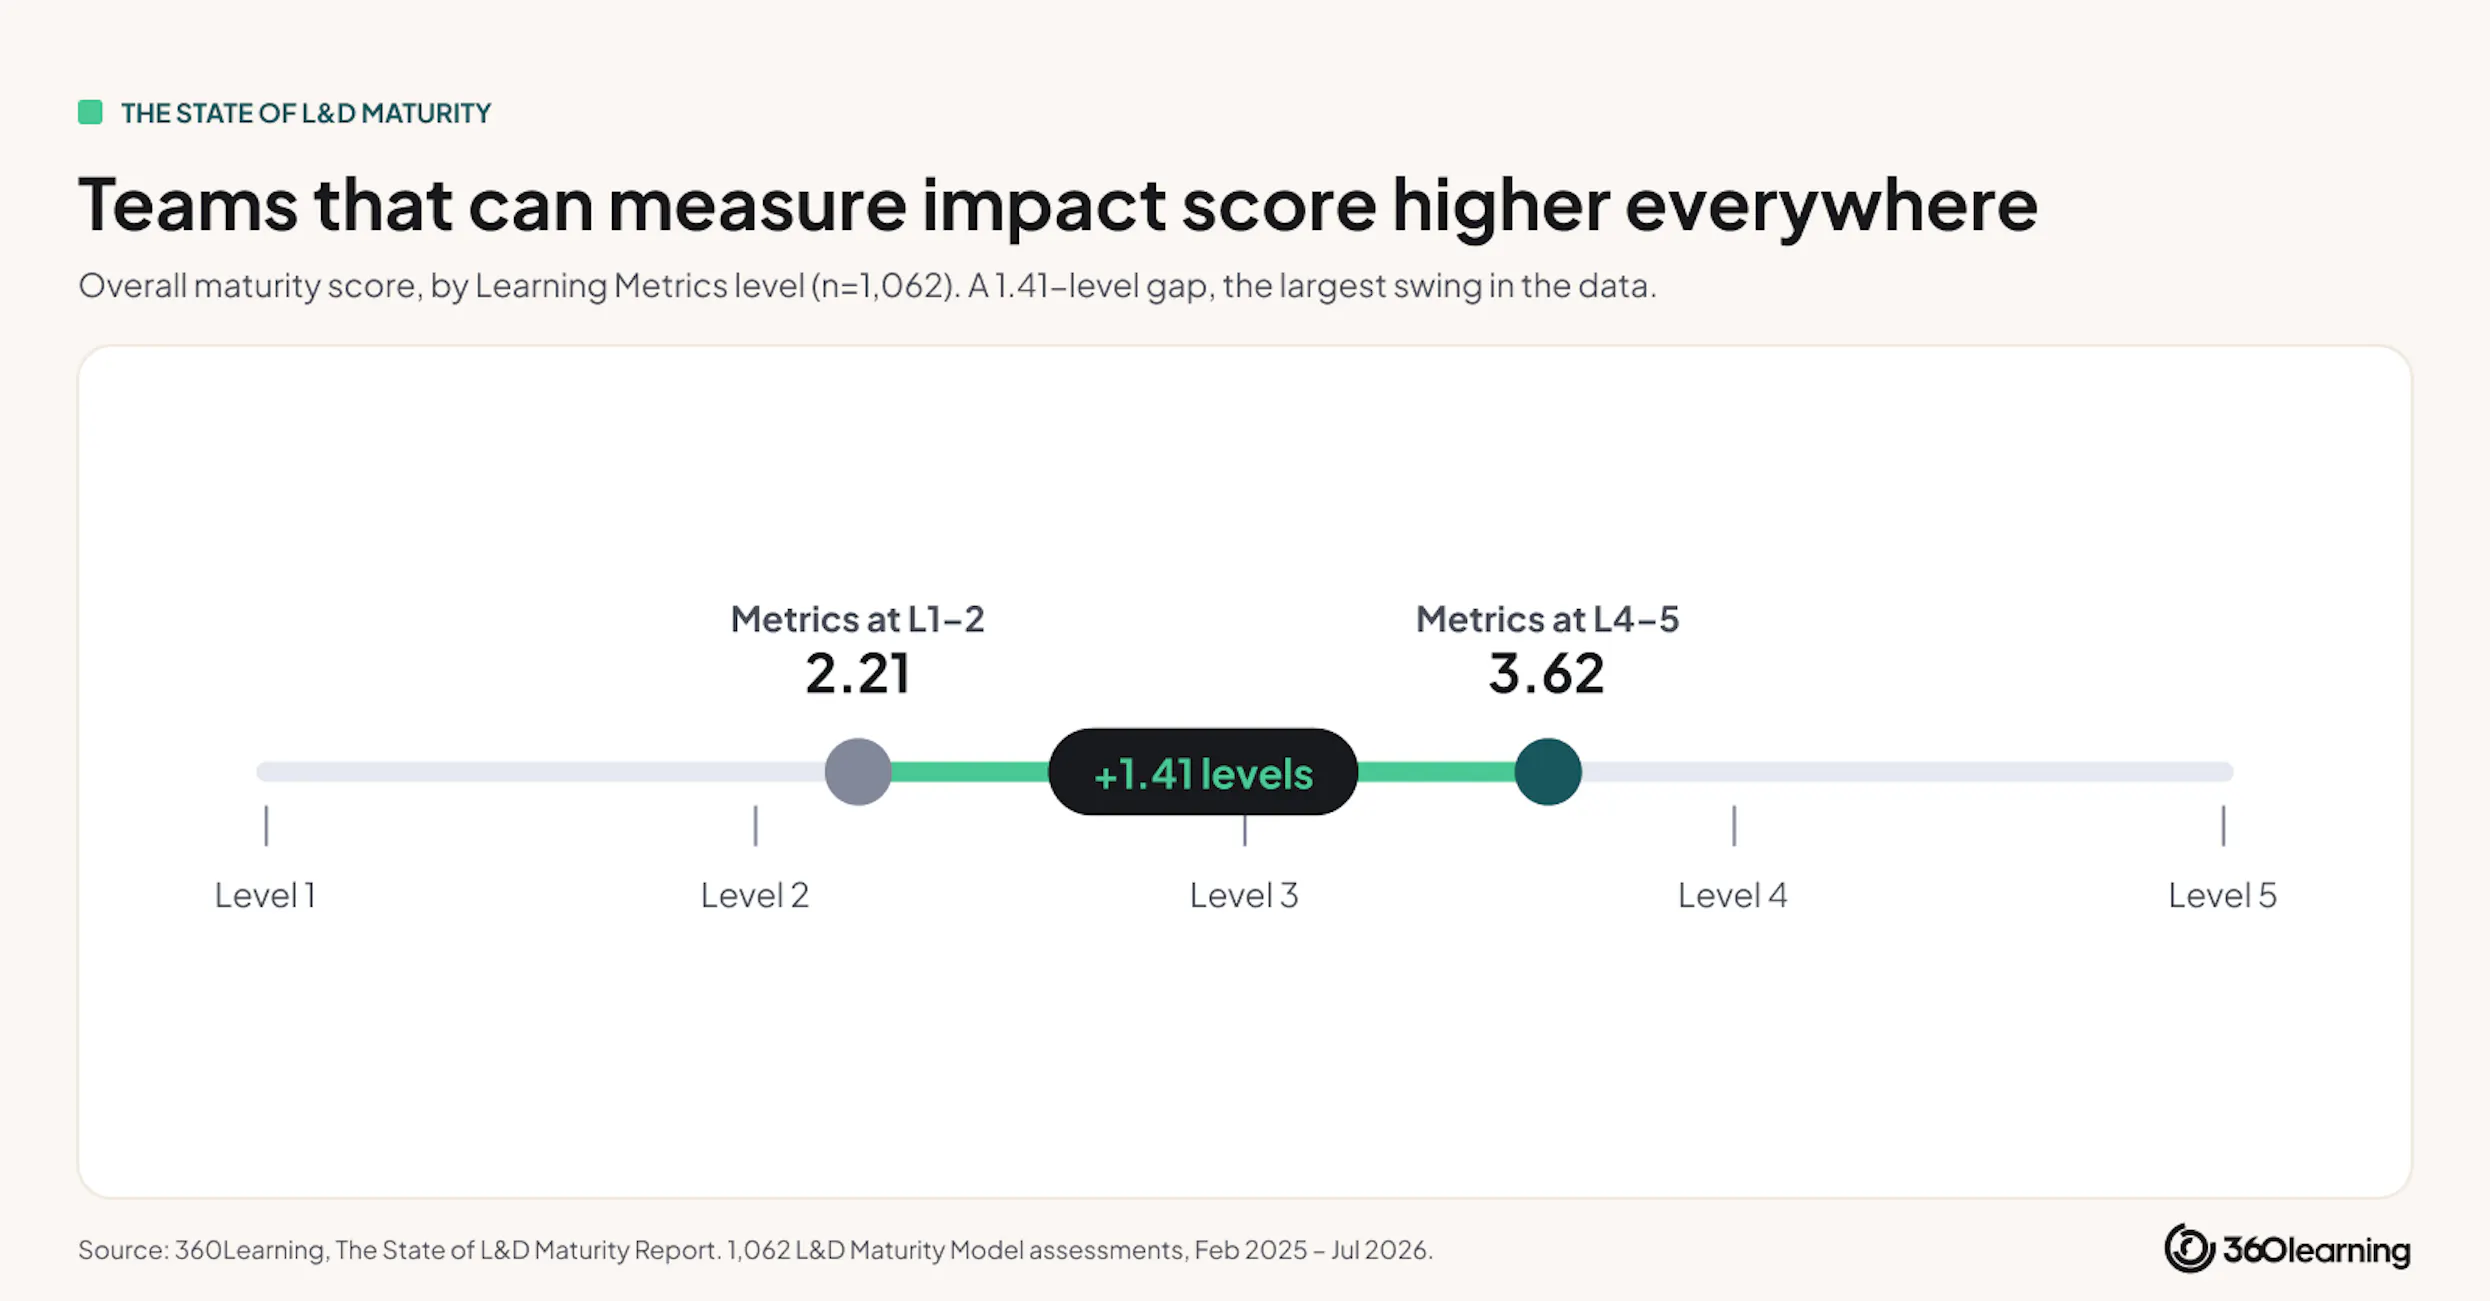
That lift isn't confined to the metrics dimension itself: the same comparison shows Learning Needs Identification up 1.62 levels, Learning Strategy up 1.27, SME Collaboration up 1.23, Leadership Alignment up 1.13, Training Processes up 1.09, and Learner Engagement up 1.00. No other dimension, cut the same way, produces anything close to this multiplier effect.
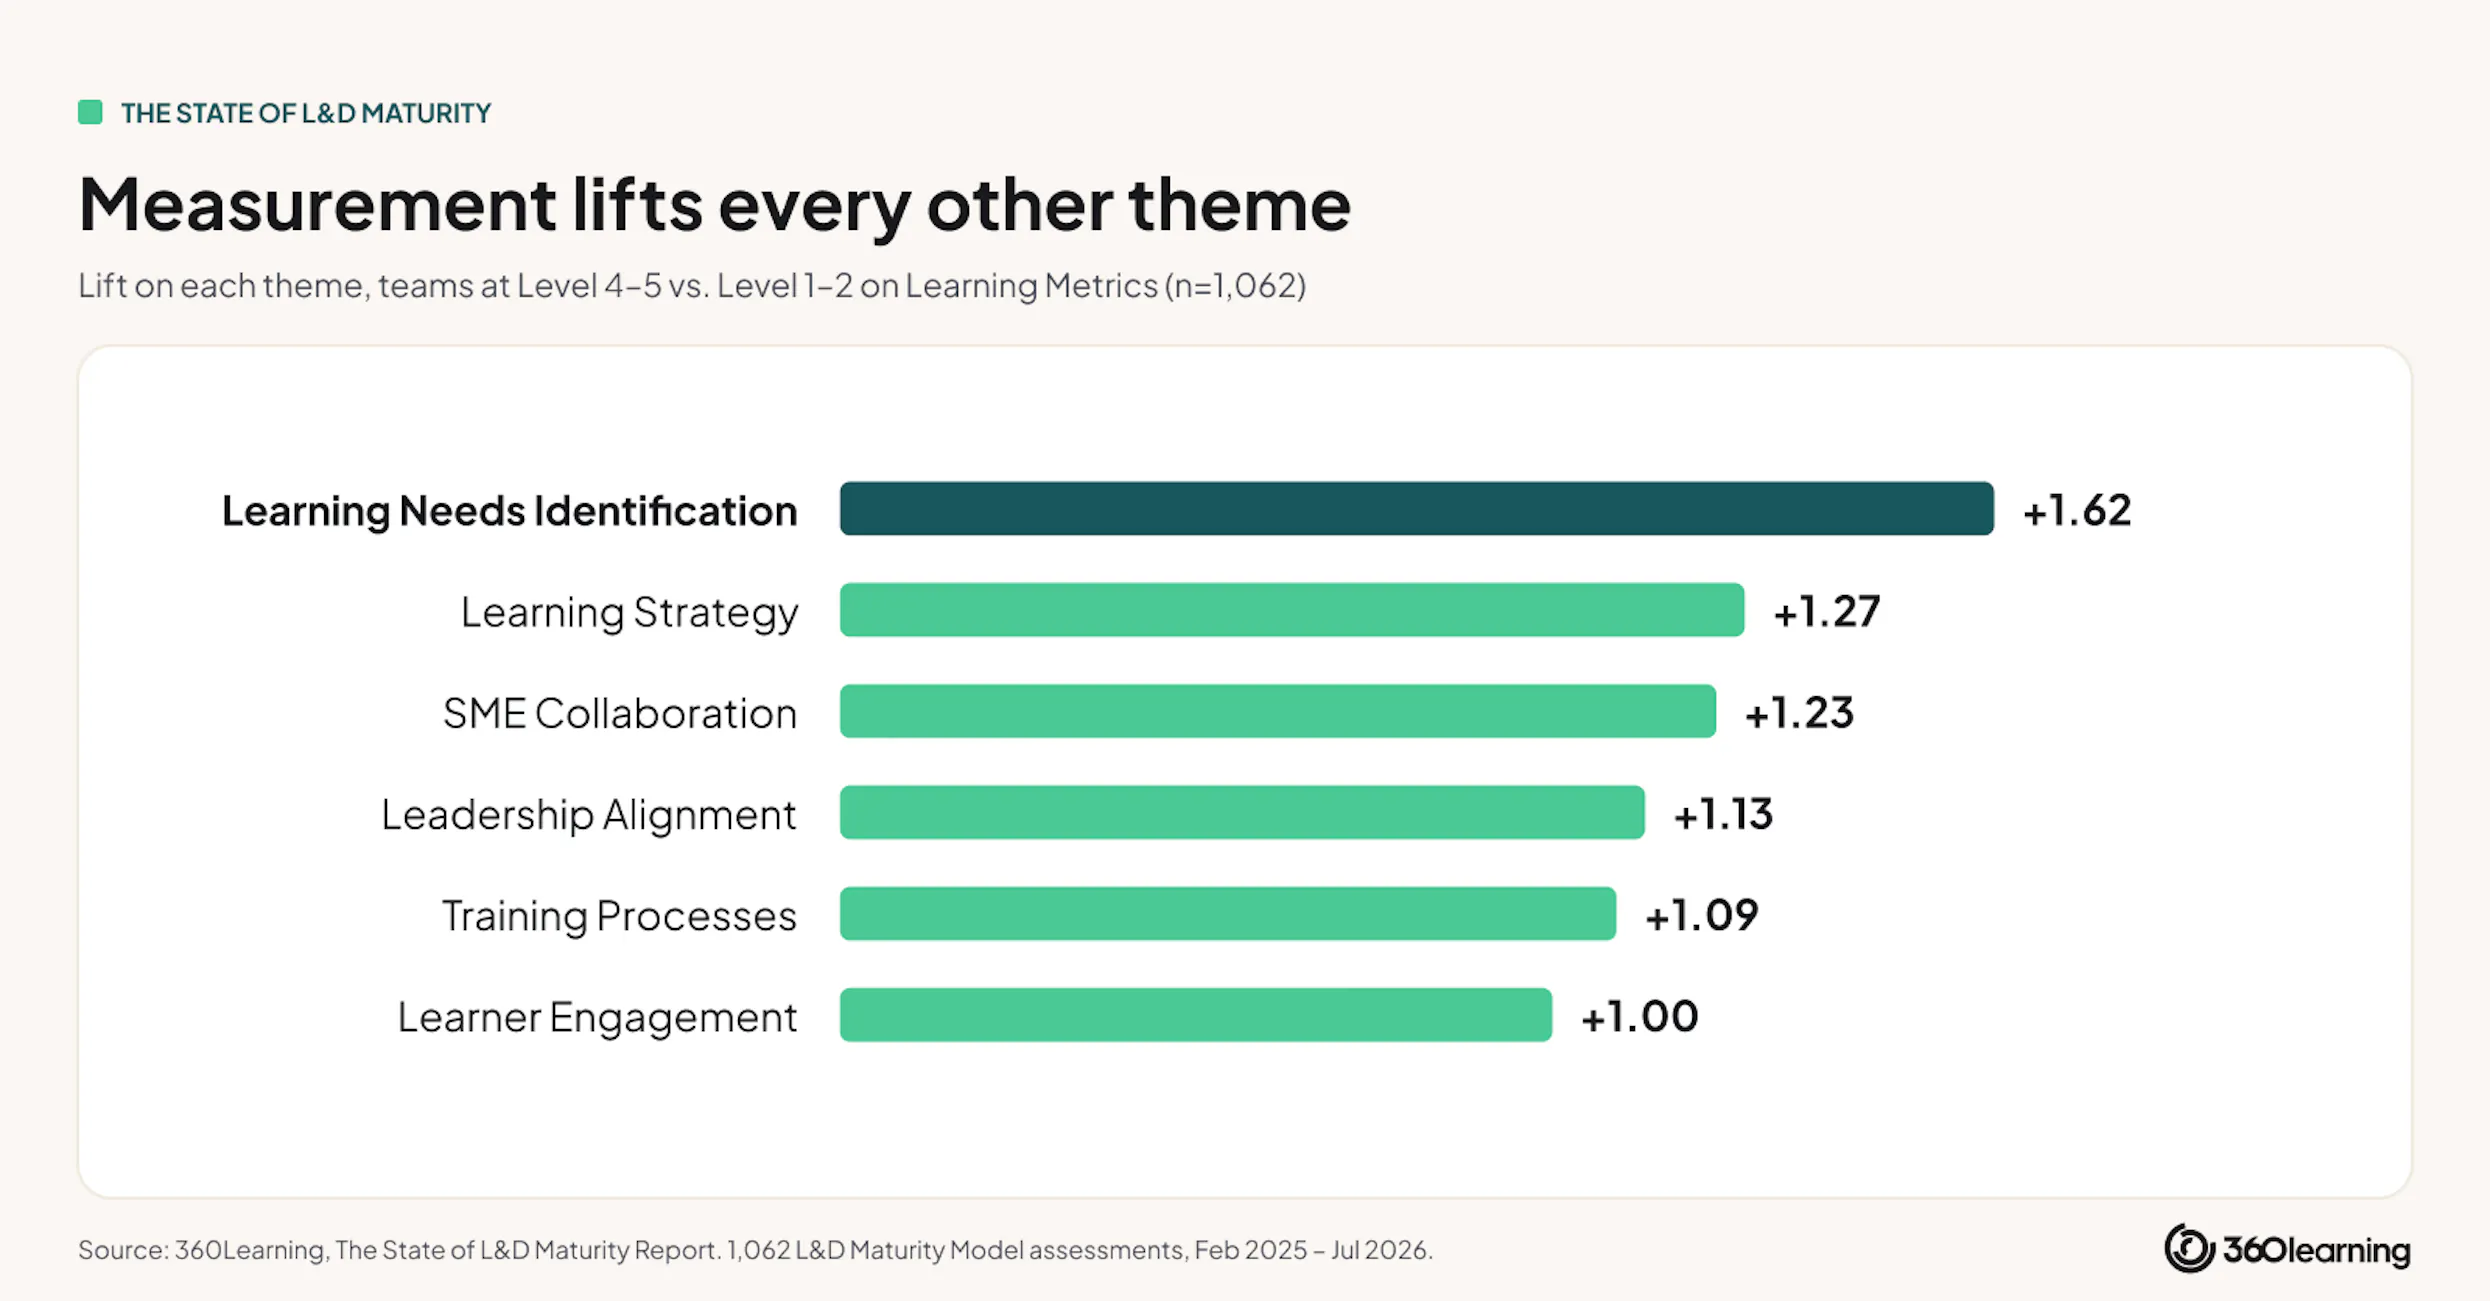
The plain reading is that measurement isn’t one capability among seven equally weighted ones — it’s closer to the mechanism by which everything else improves. Teams that can put a number on learning’s impact are the same teams that get the leadership alignment, the SME participation, and the process investment to keep improving everywhere else.
And the scale of the gap is sobering given how few teams have crossed it: 63% of the entire sample — nearly two in three L&D teams — still sit at Level 1 or 2 on Learning Metrics. That’s the wall in front of most of the profession, and it’s the highest-leverage place to start climbing.
Next chapter: Part three: What differentiates higher-maturity organizations
 Our weekly newsletter of the best insights from L&D peer to L&D peer.
By providing your contact info, you agree to receive communications from 360Learning. You can opt-out at any time. For details, refer to our Privacy Policy.