
A Deep Dive into Conducting a Learner Needs Analysis from A to Z

Published on
Updated on
I’ve been doing analysis for instruction, training, and learning since 1979. When I joined a consulting firm in 1982, I took over the training practice and needed to standardize our analysis methods for use by my business partners, staff, and subcontractors.
I wanted to make some changes; I wished to operate more as an engineering organization than as an artist colony. I wanted methods that were as rigorous as required but as flexible as feasible, especially regarding the types of analysis we provided to prospects and clients:
Performance competence and gap analysis captures the requirements for outputs and their key measures and associated tasks, the roles & responsibilities, and the typical gaps for use downstream in design.
Target audience analysis captures various demographics data and the incoming knowledge/skills from education and experiences to influence the downstream modular design and deployment strategies and tactics.
Enabling knowledge and skills analysis captures the enabling K/S using up to 17 categories of K/S and links each K/S item back to the sets of outputs & task data for use downstream in design.
Existing content for reuse assessment captures an assessment of all existing content for its reuse potential in downstream design and development to avoid redundant and unnecessary first costs and increased life cycle costs.
I was able to make those changes and establish a process that I’ll be sharing with you today. In this article, I’ll focus in detail (and with concrete examples) on how to successfully conduct a rigorous performance competence and gap analysis, since this is the most critical of the four listed above. By the end, you’ll be able to apply this type of analysis in your place of work to help shore up performance gaps.
How to set up a performance competence and gap analysis
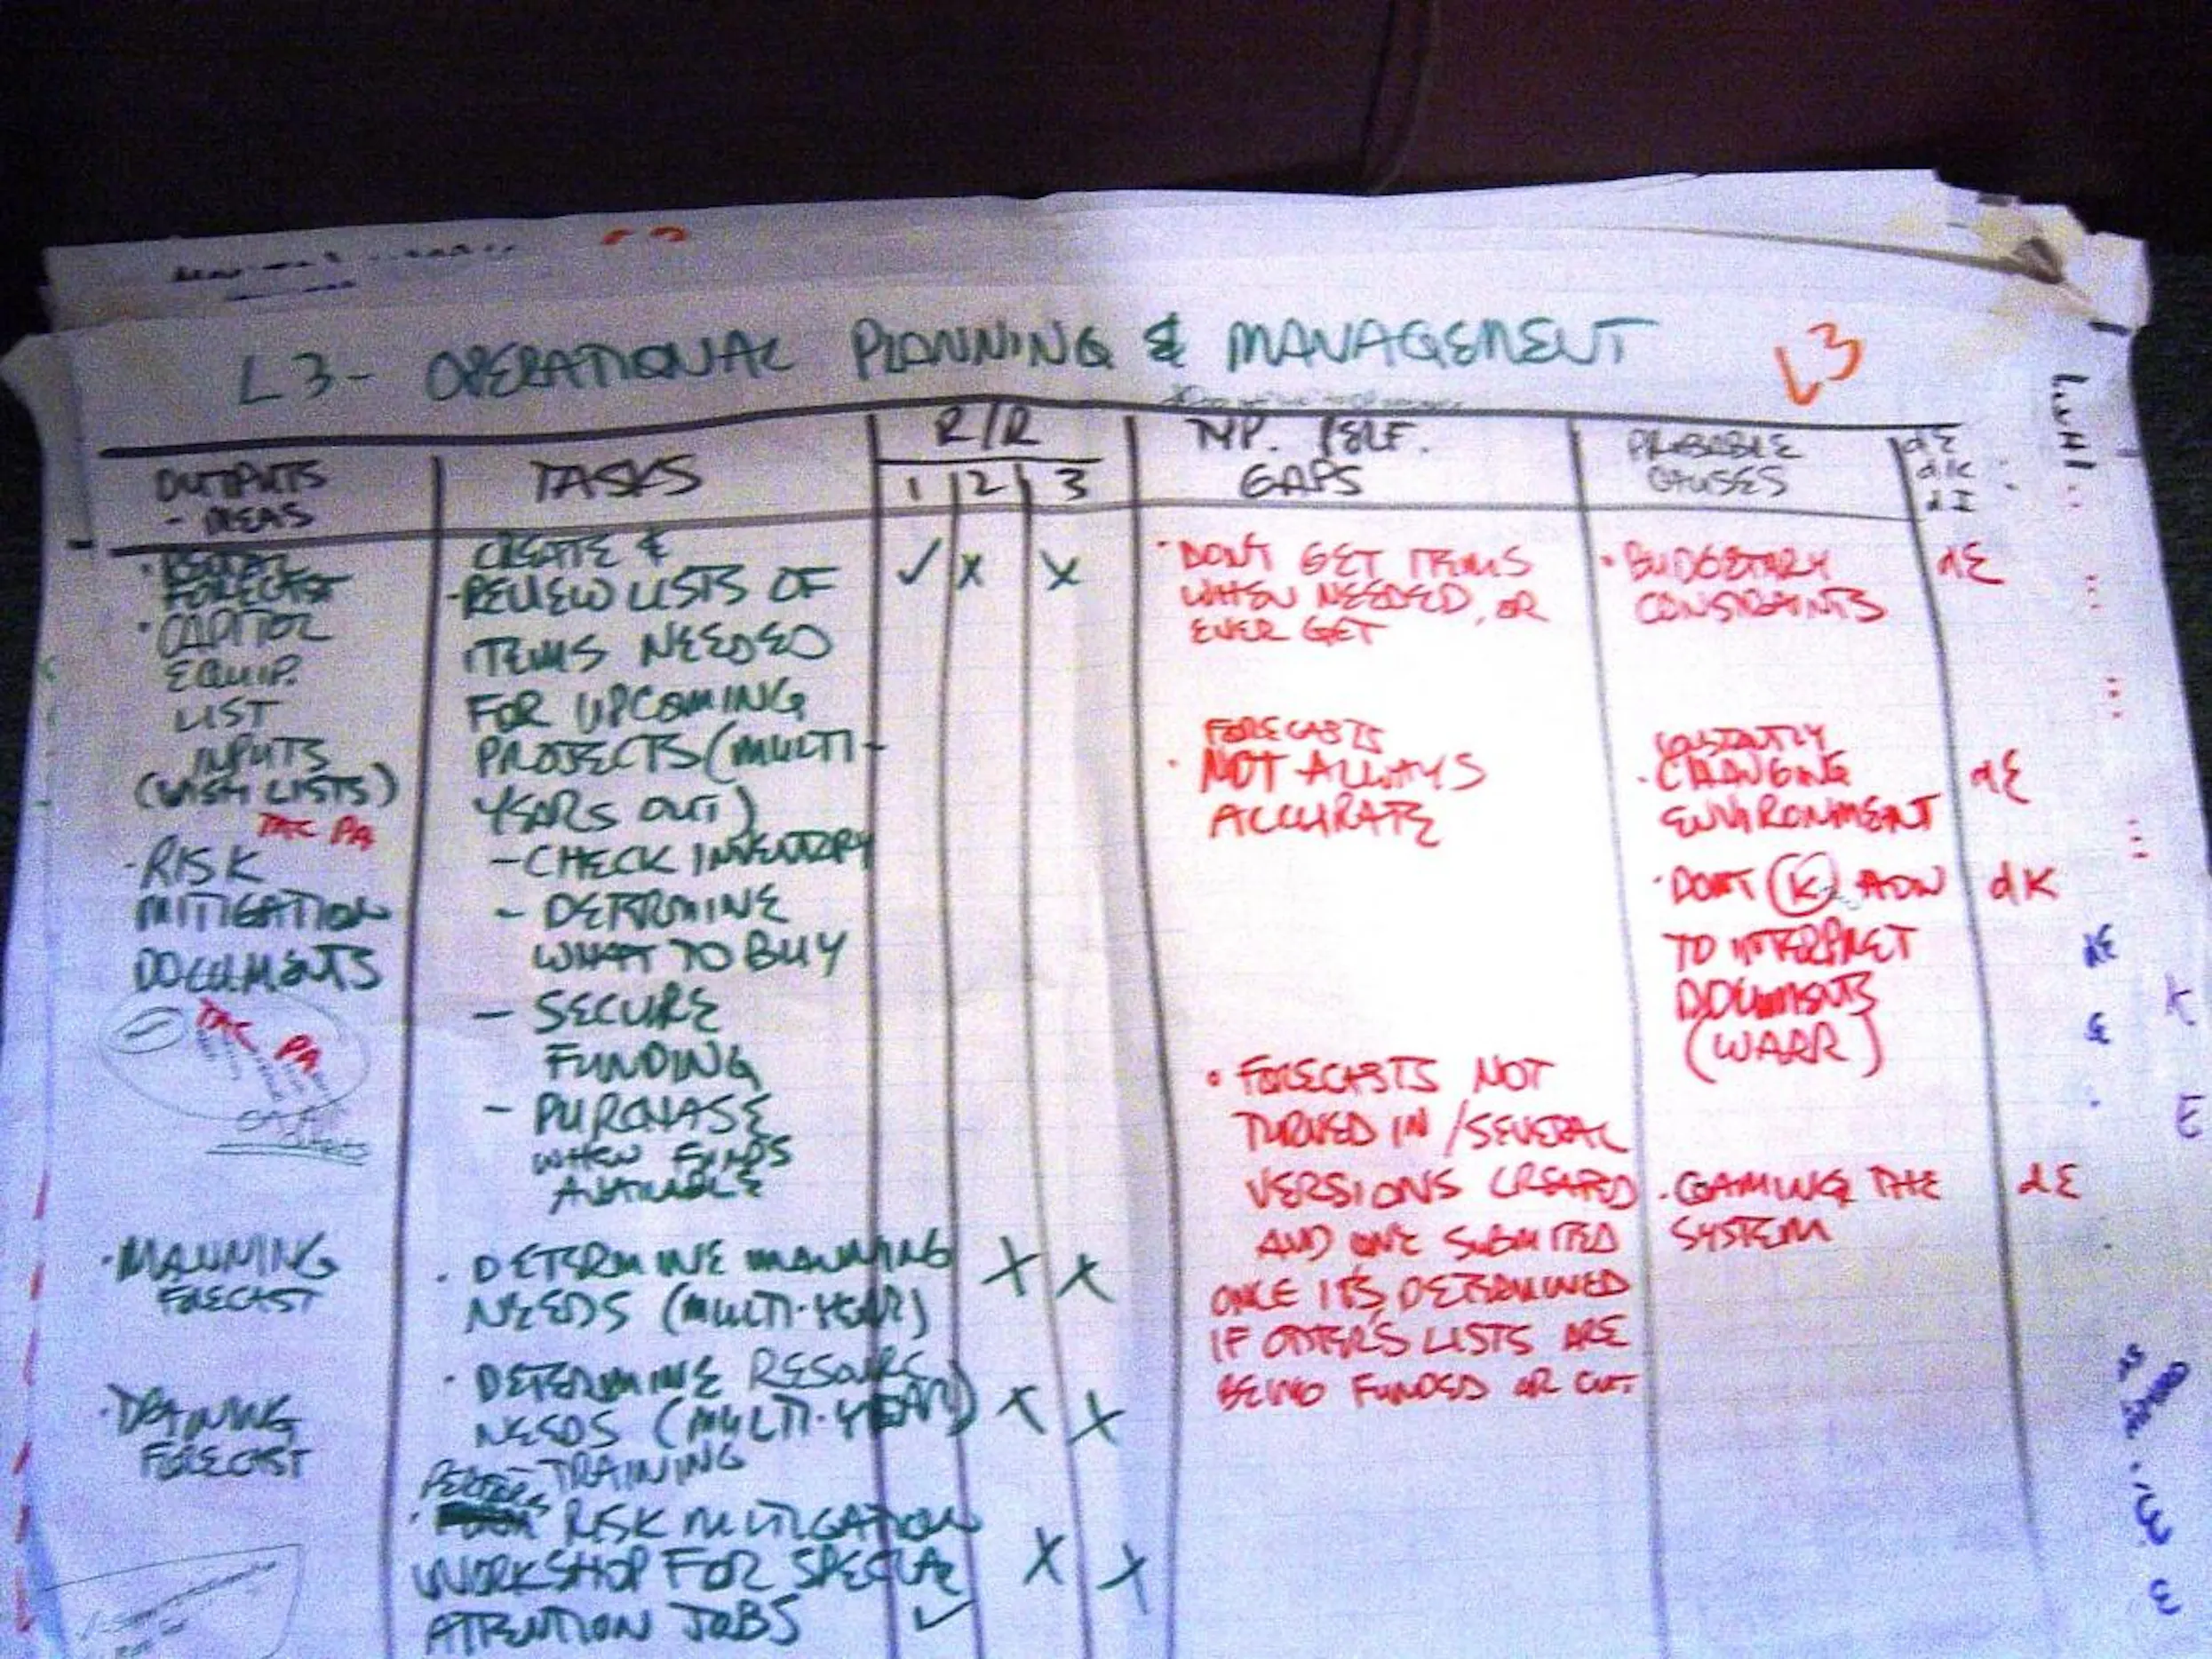
Analysis data from performance competence and gap analysis is absolutely vital. In a nutshell, this data defines the ideal performance and the gaps on one page. As you can see below, I use a performance model chart format to capture and report this data.
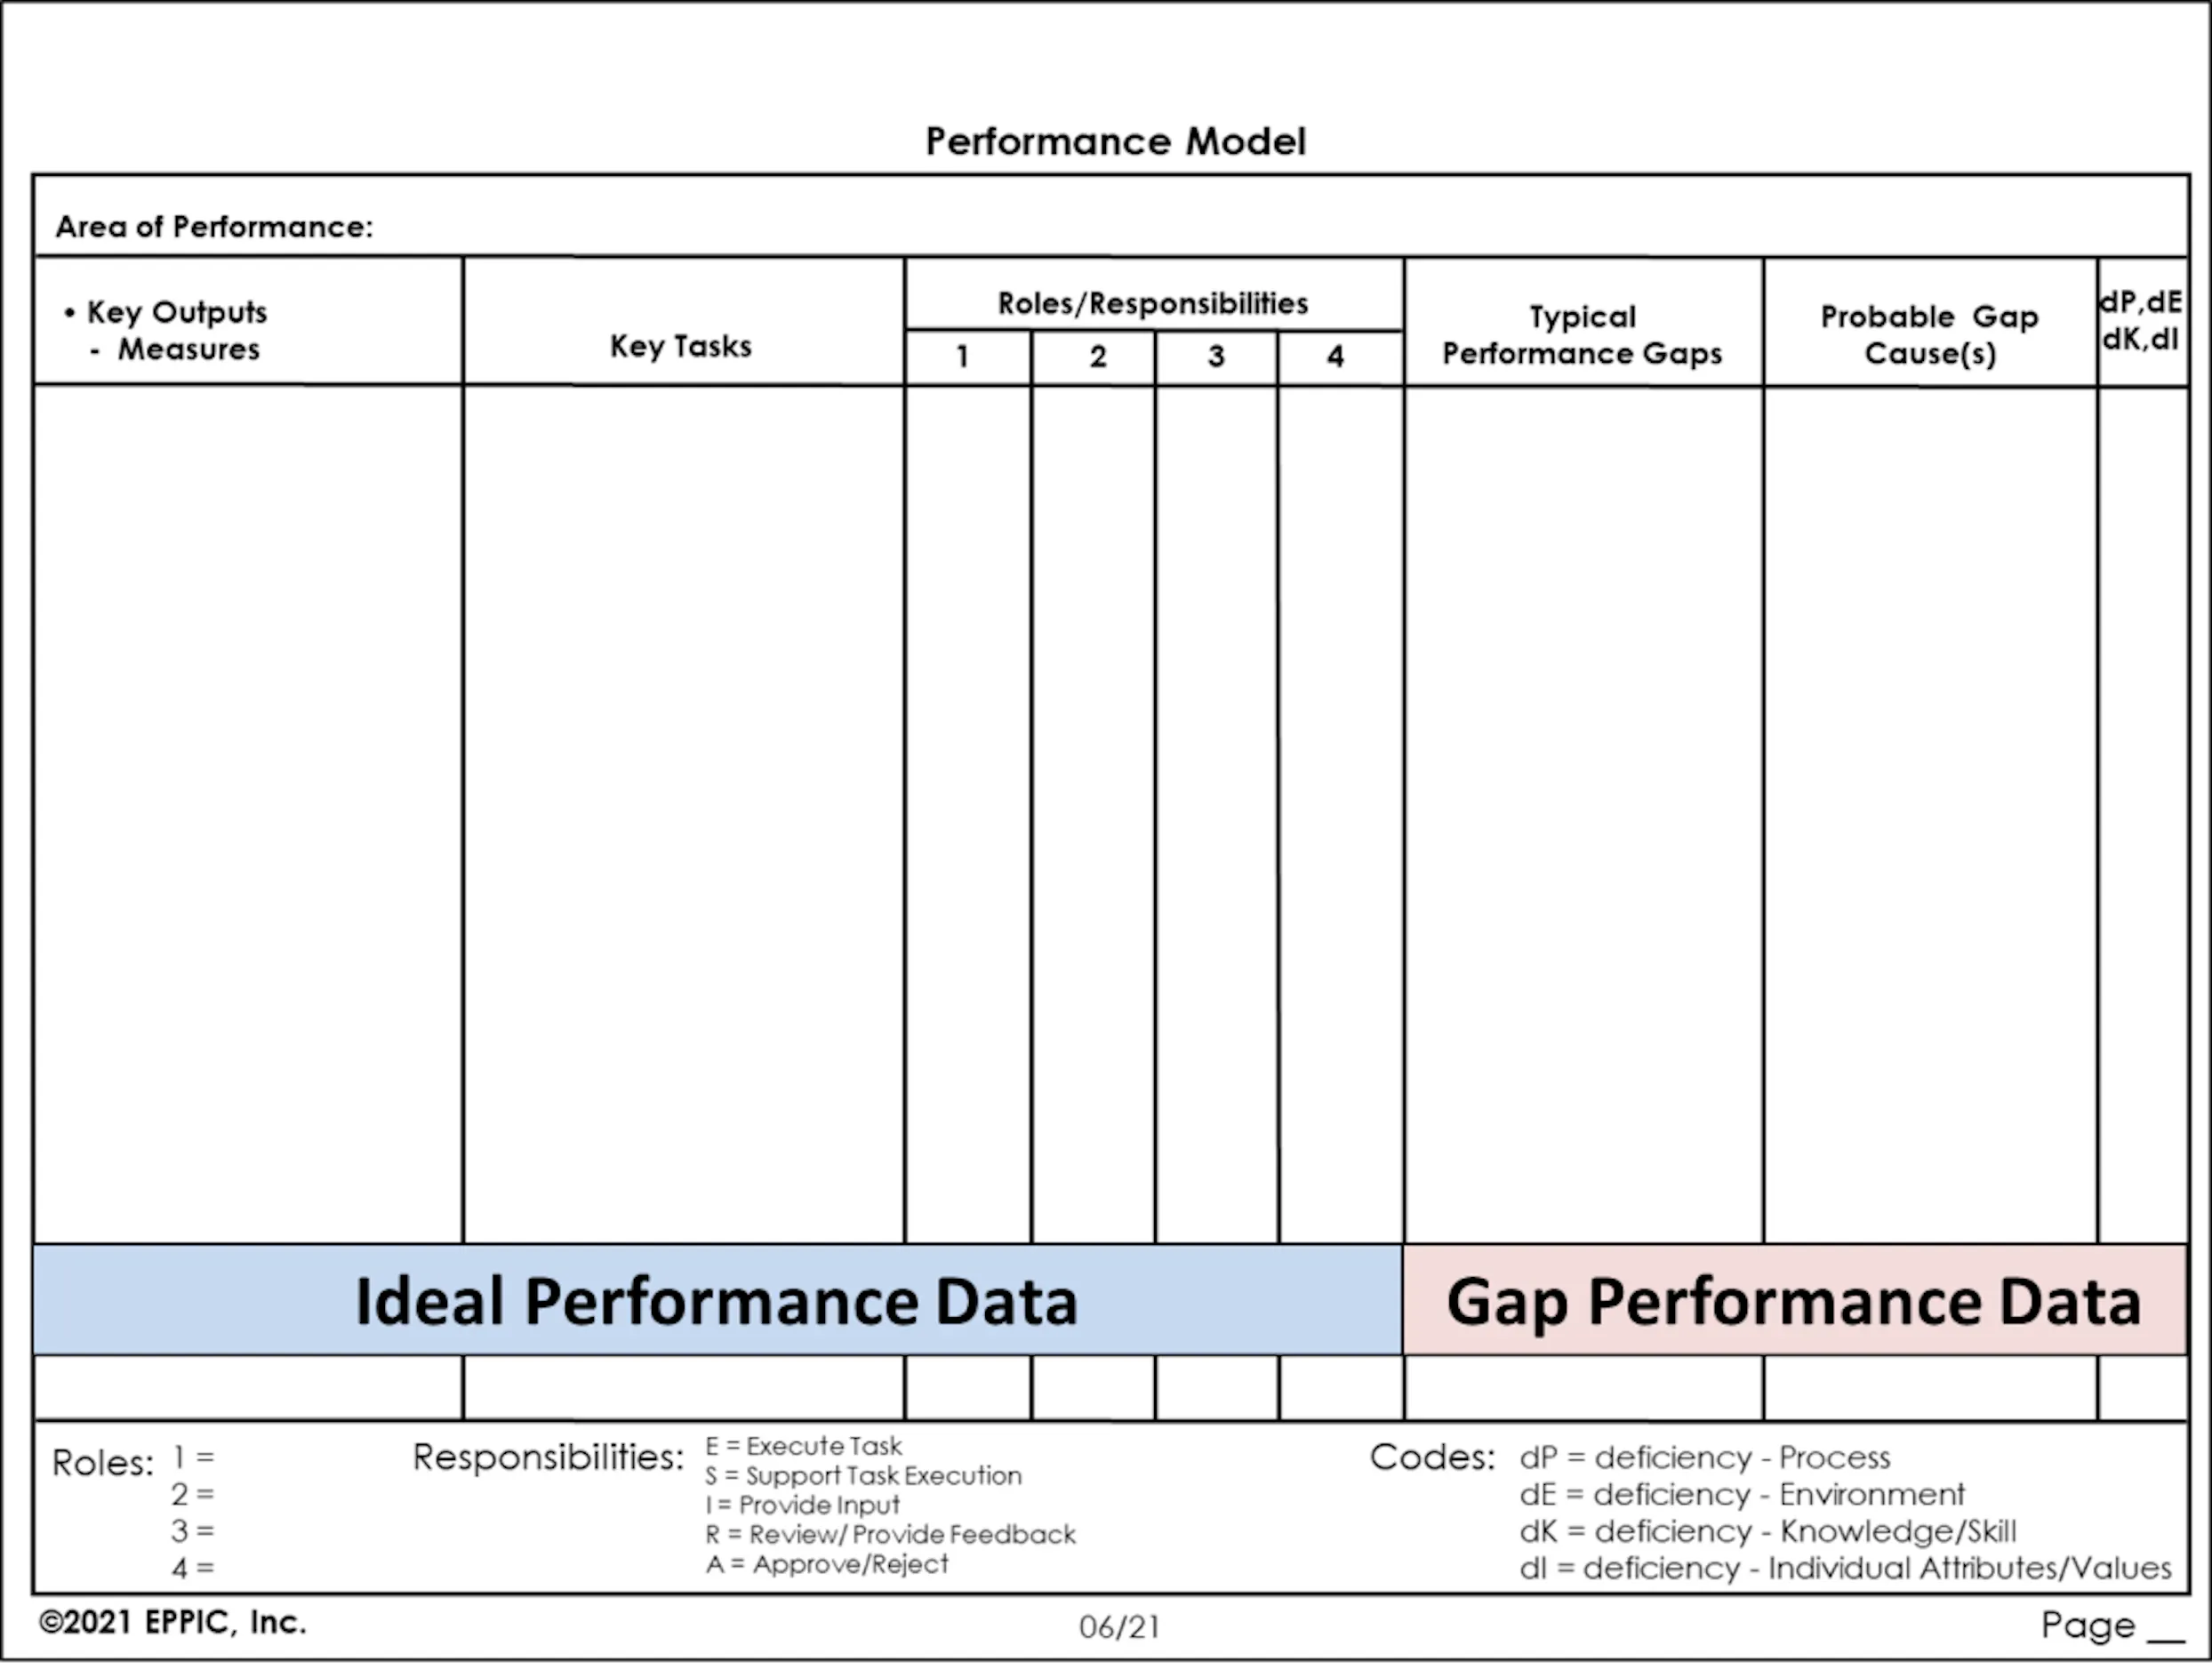
The left-hand side captures and reports out the Ideal Performance, and the right-hand side captures and reports out the gap performance against the ideal.
I call the process for generating the data performance modeling. Performance modeling generally includes these two efforts:
- Segmentation of overall performance into areas of performance (AoP)
- Detailing the outputs and their measures, the standards for the measures, the tasks per output, and the roles and responsibilities per task
Step 1: Areas of performance (AoP)
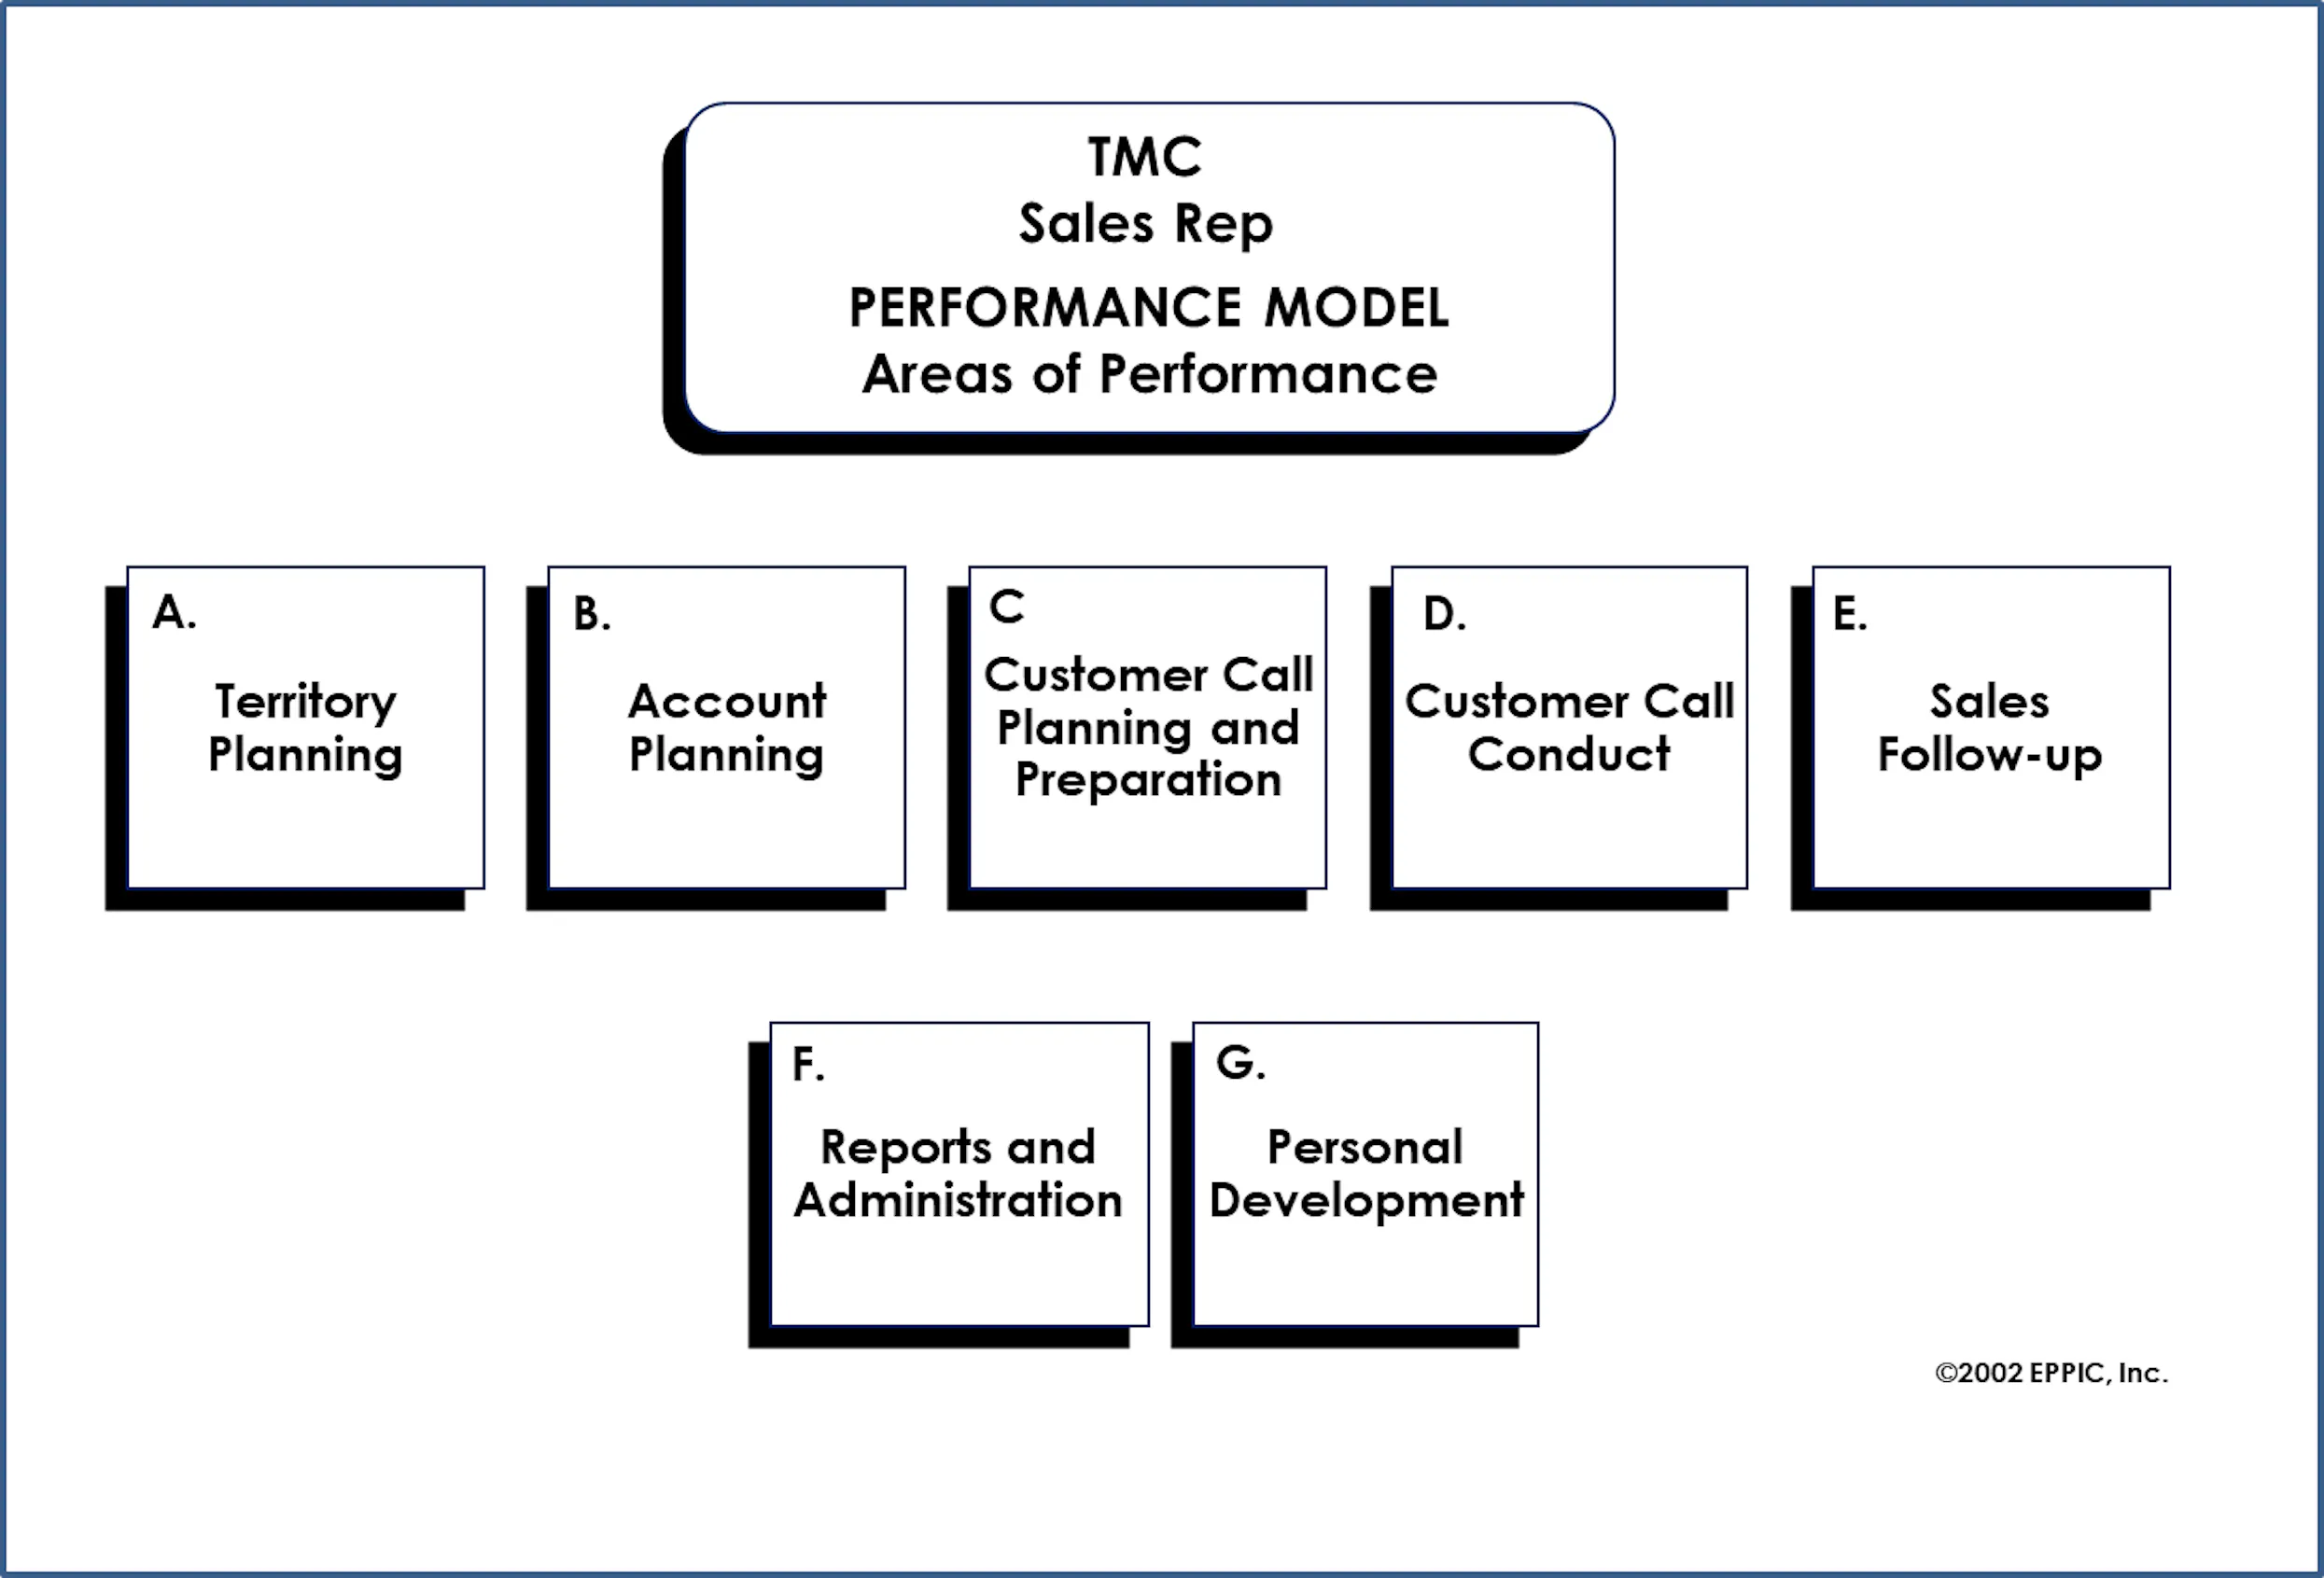
This performance modeling effort creates a work breakdown structure of the performance within the scope of the intended project. These “chunks” that I label as AoPs – areas of performance — are also known as major duties, key Results areas, accomplishments, etc. Use language that resonates in your context.
Here is an example of the AoPs for a Sales Account Representative. Note that there are seven AoPs.
Step 2: Outputs and their measures
The performance model chart is also used to capture the details for each AoP, including outputs and their measures. Note that there could be one page or many pages per AoP.
Here is an example of one performance model chart page for the first AoP: territory planning.
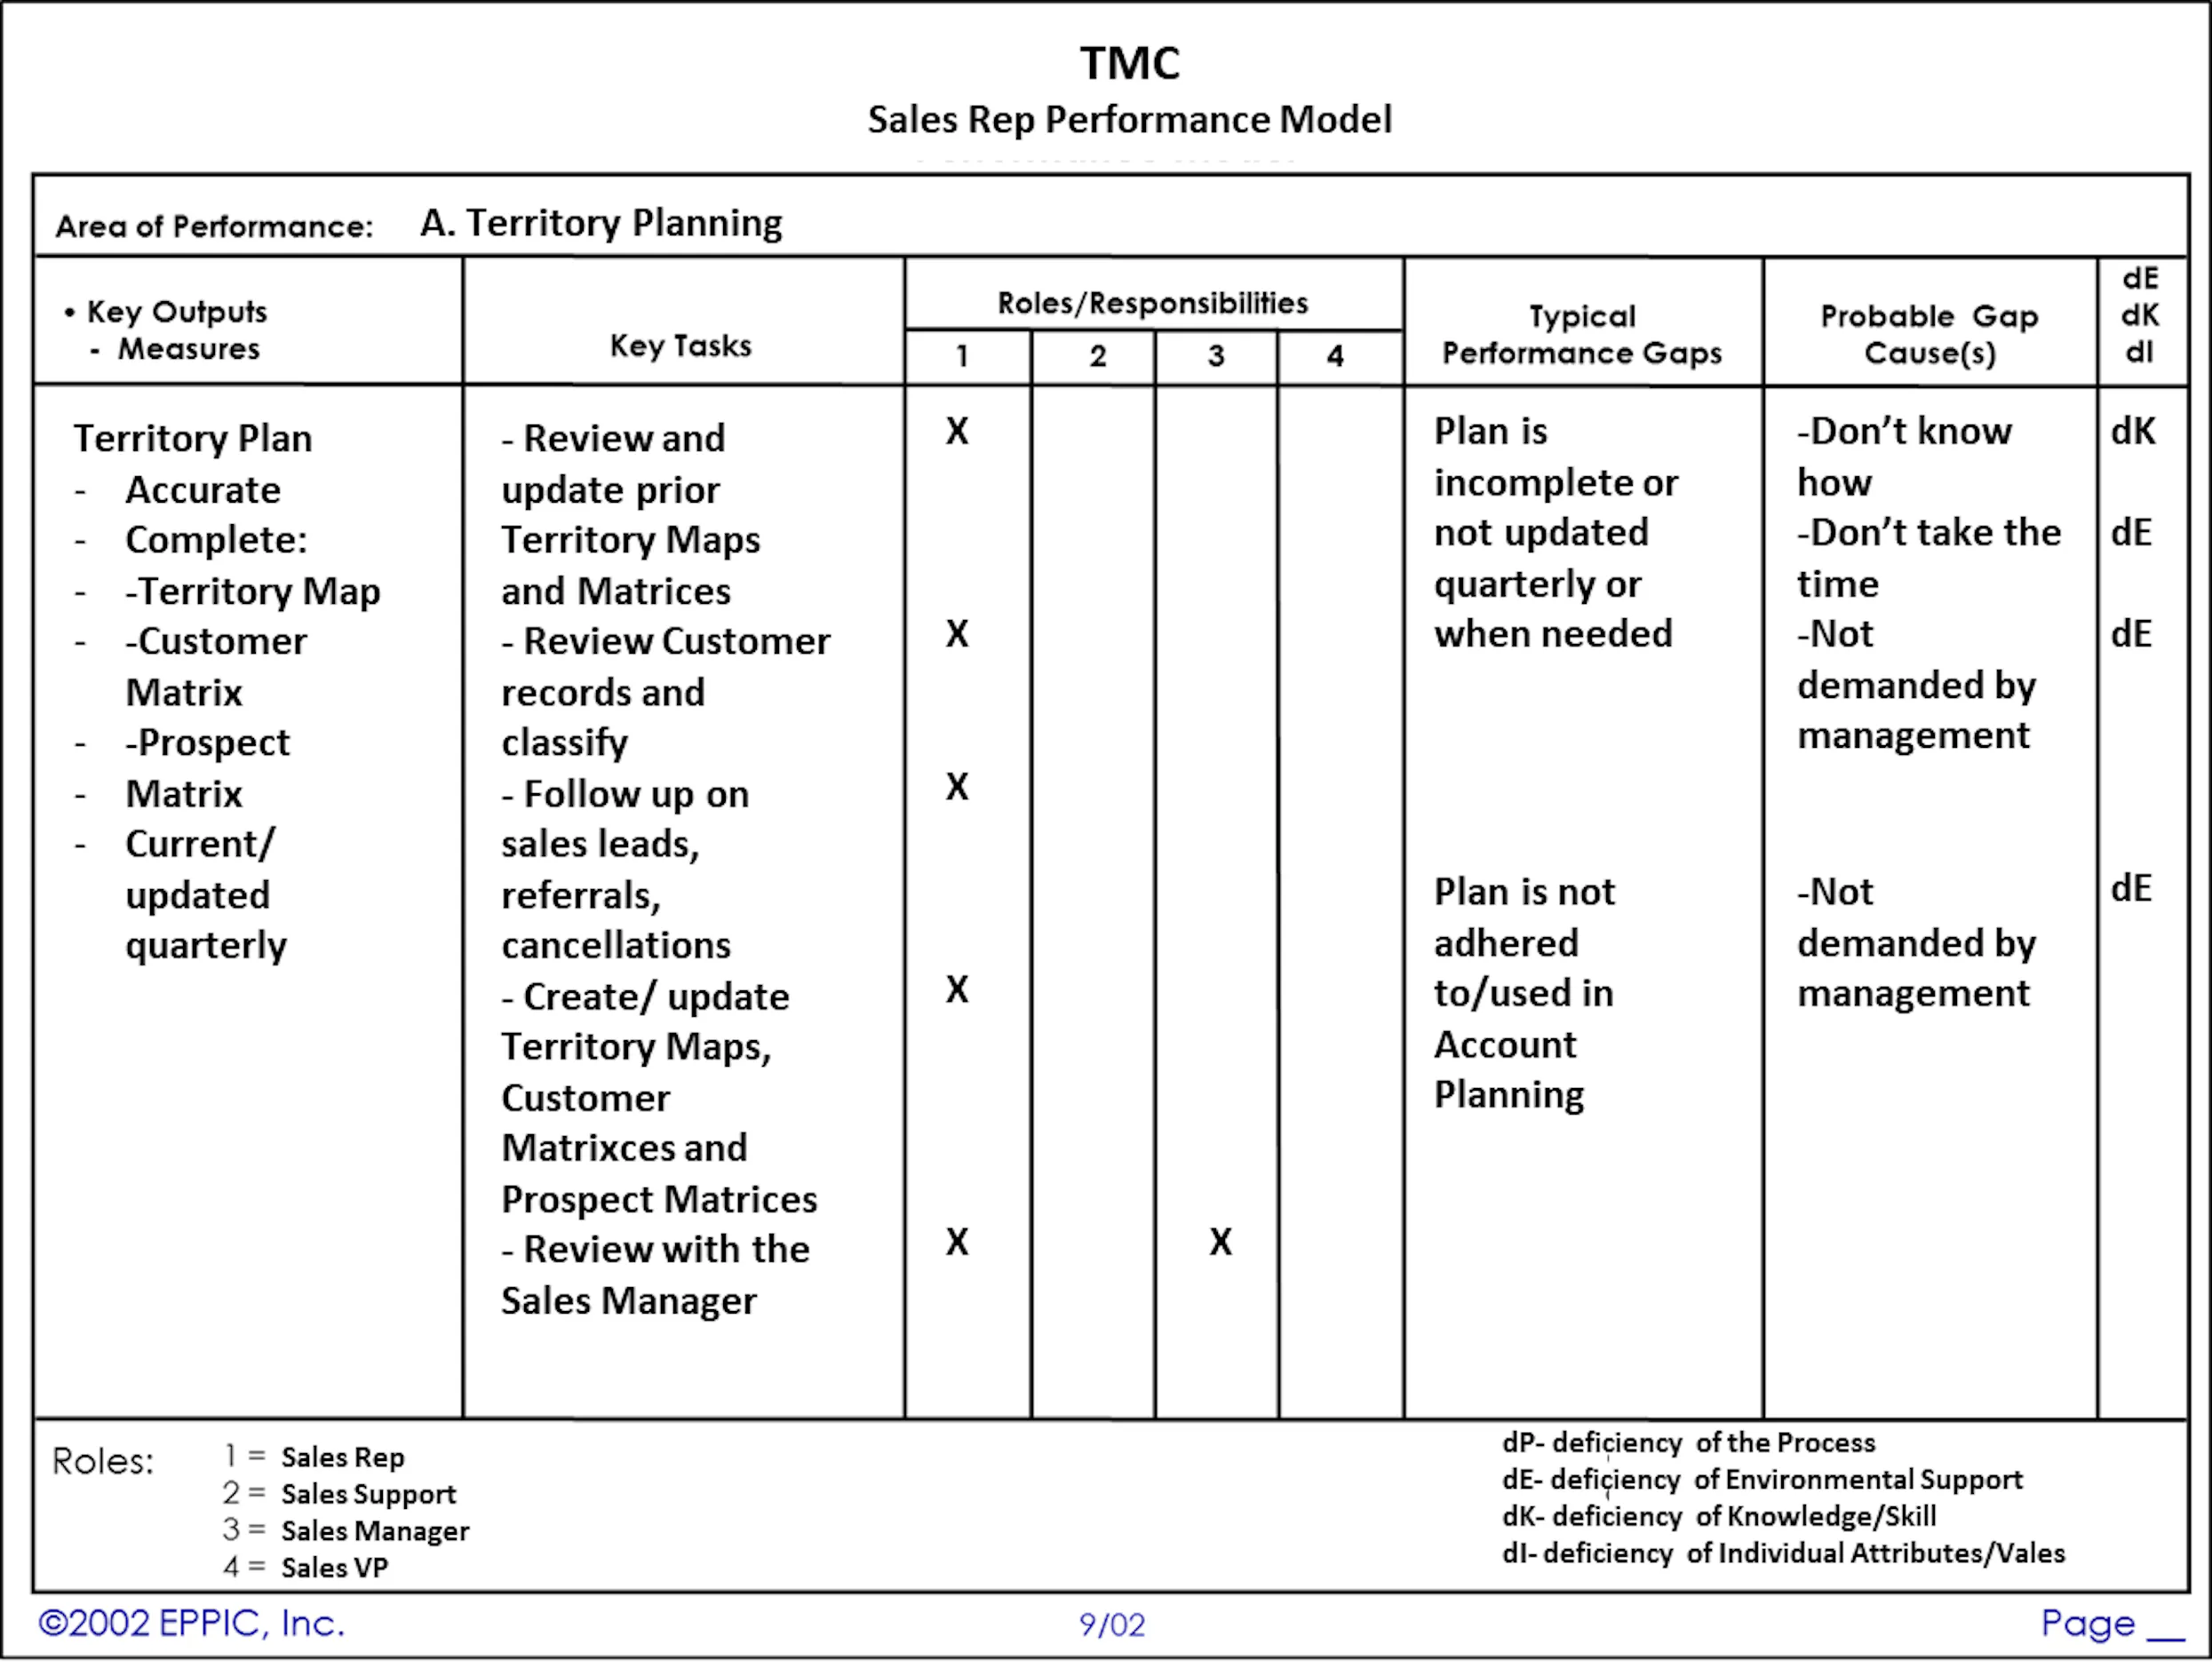
When I study complete jobs (job titles), I might generate twenty to thirty pages of performance model charts to capture the details for anywhere from six to twelve AoPs.
When the scope is narrower, such as “territory planning,” we might generate one to three pages of performance data.
How to generate ideal and gap performance data
Again, the left half of a performance model chart describes ideal Performance. For each AoP, this includes the:
- Outputs produced and their key measures.
- Tasks performed, per output.
- Roles and responsibilities per task.
When I teach others my methods, I have them use the below list of starter questions to create their own questions to help identify this data, and encourage them to use them to document the responses on the performance model chart.
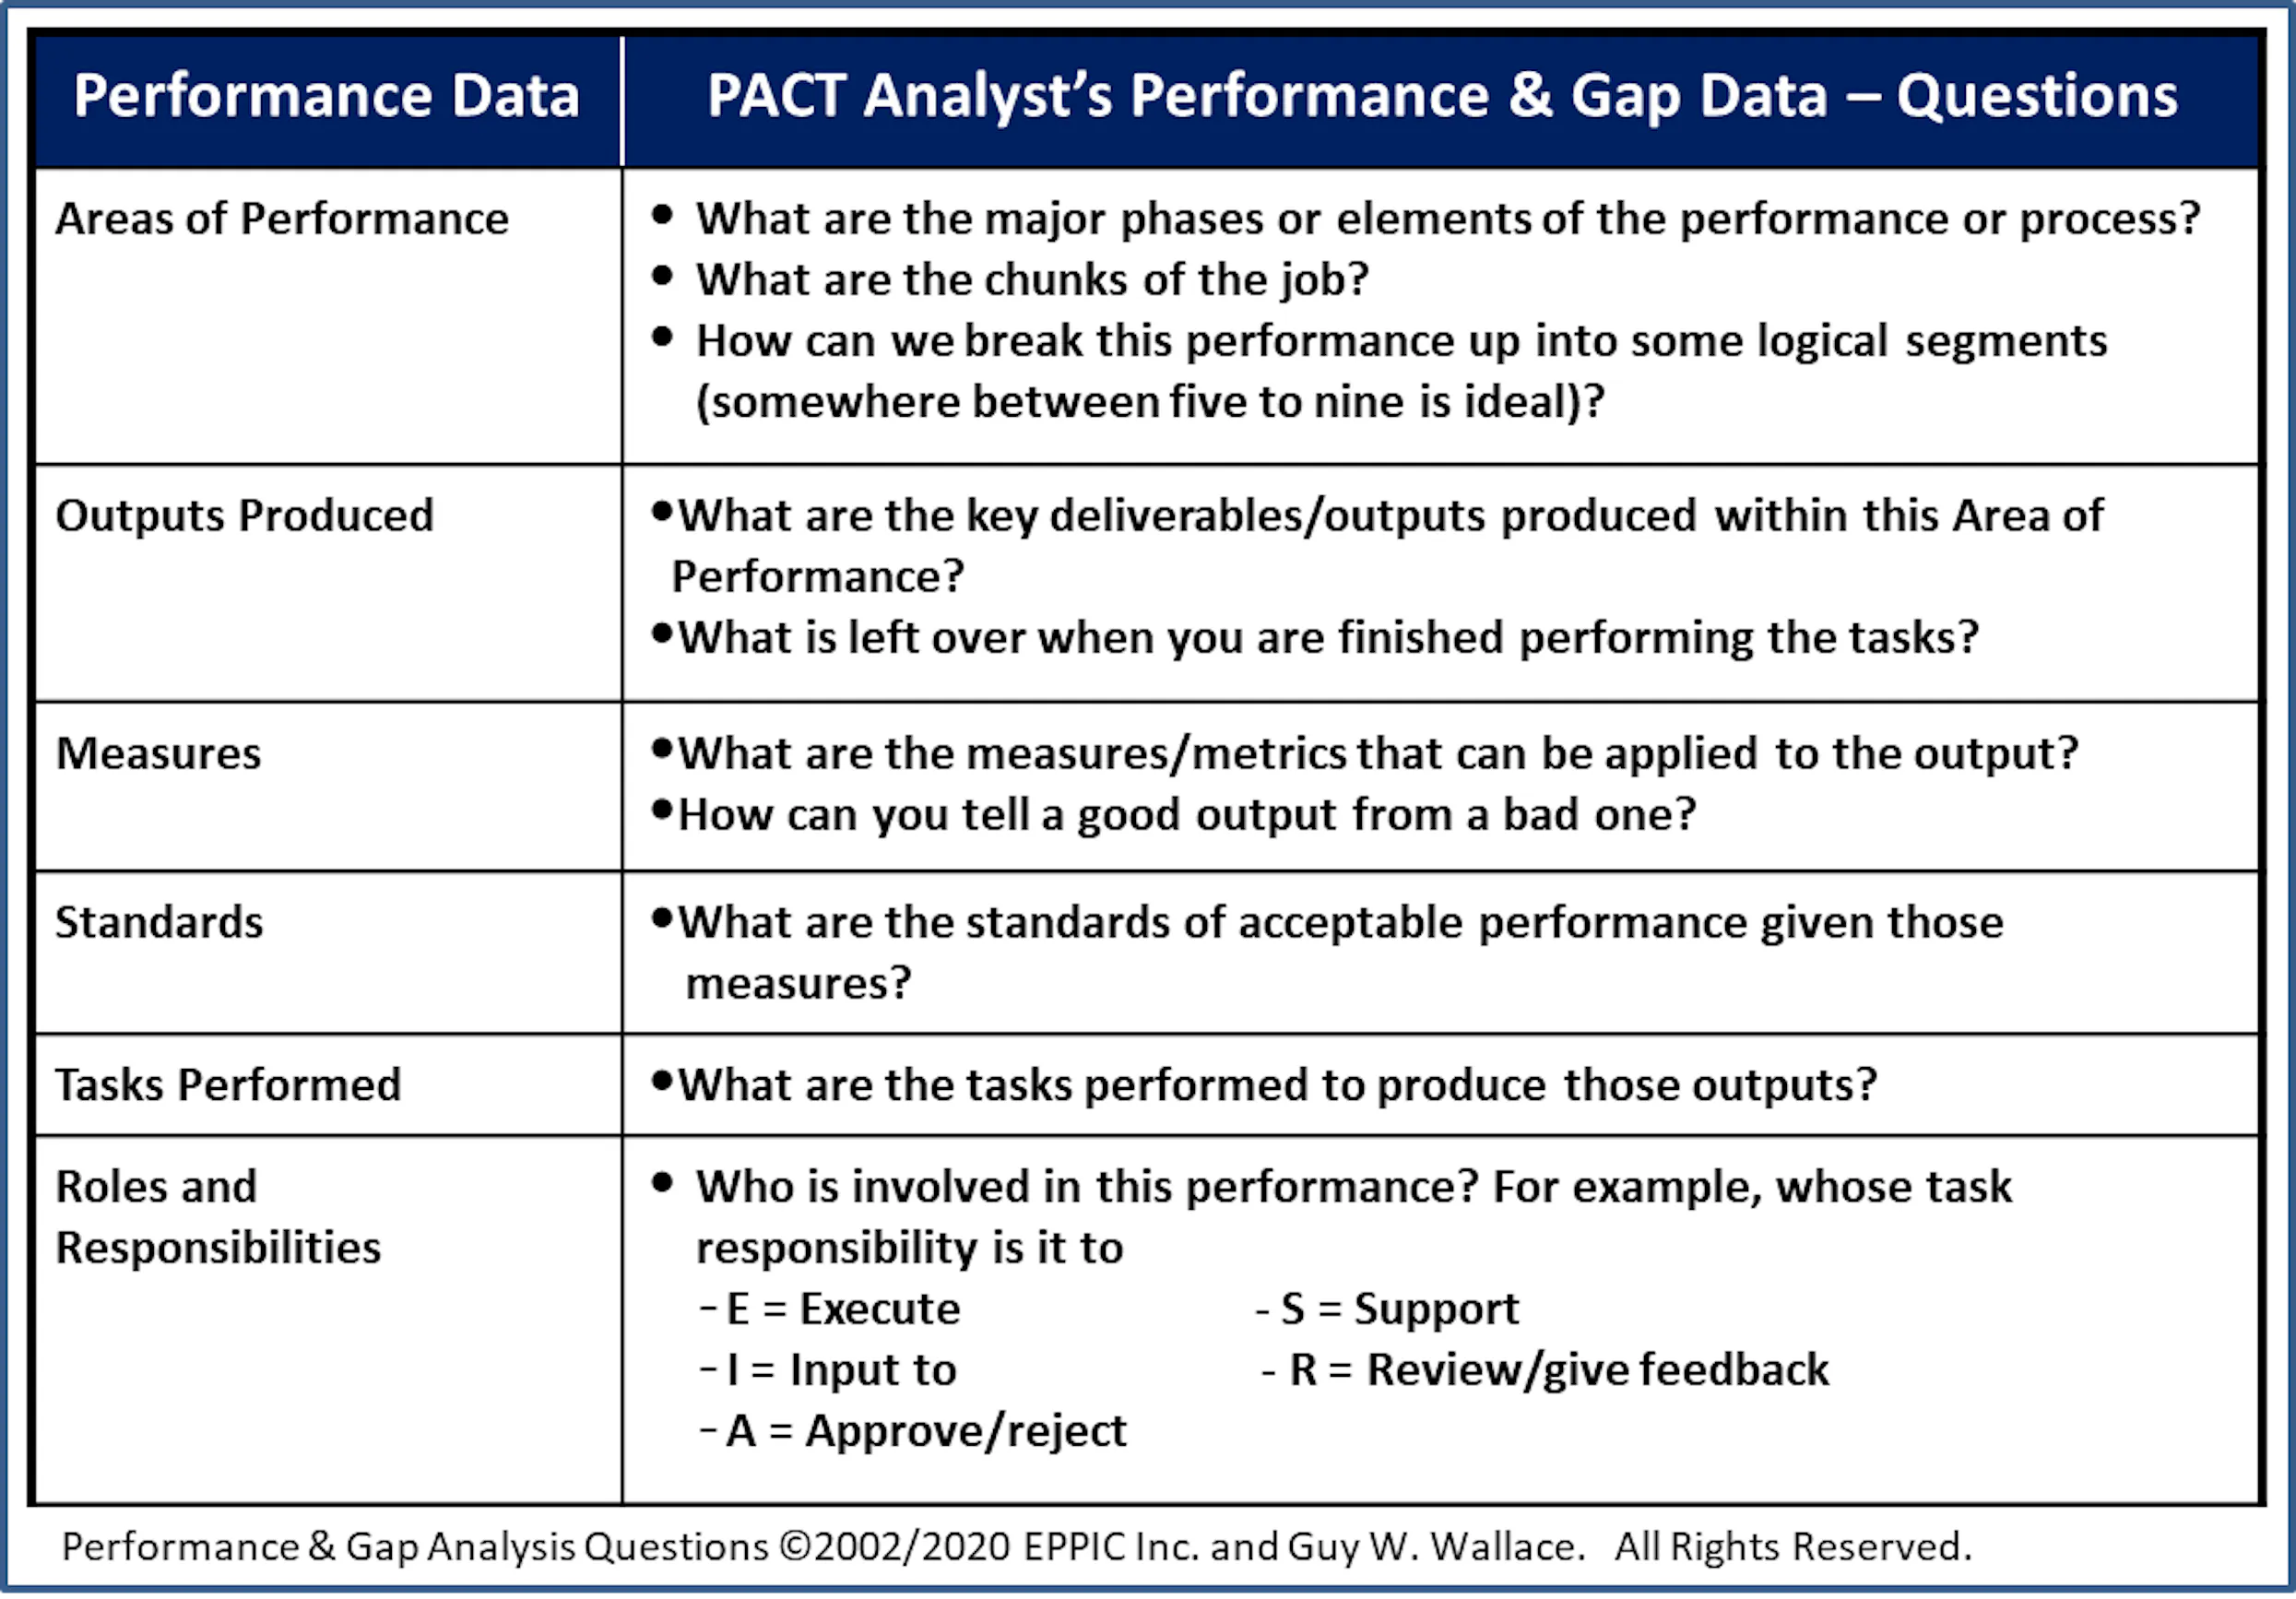
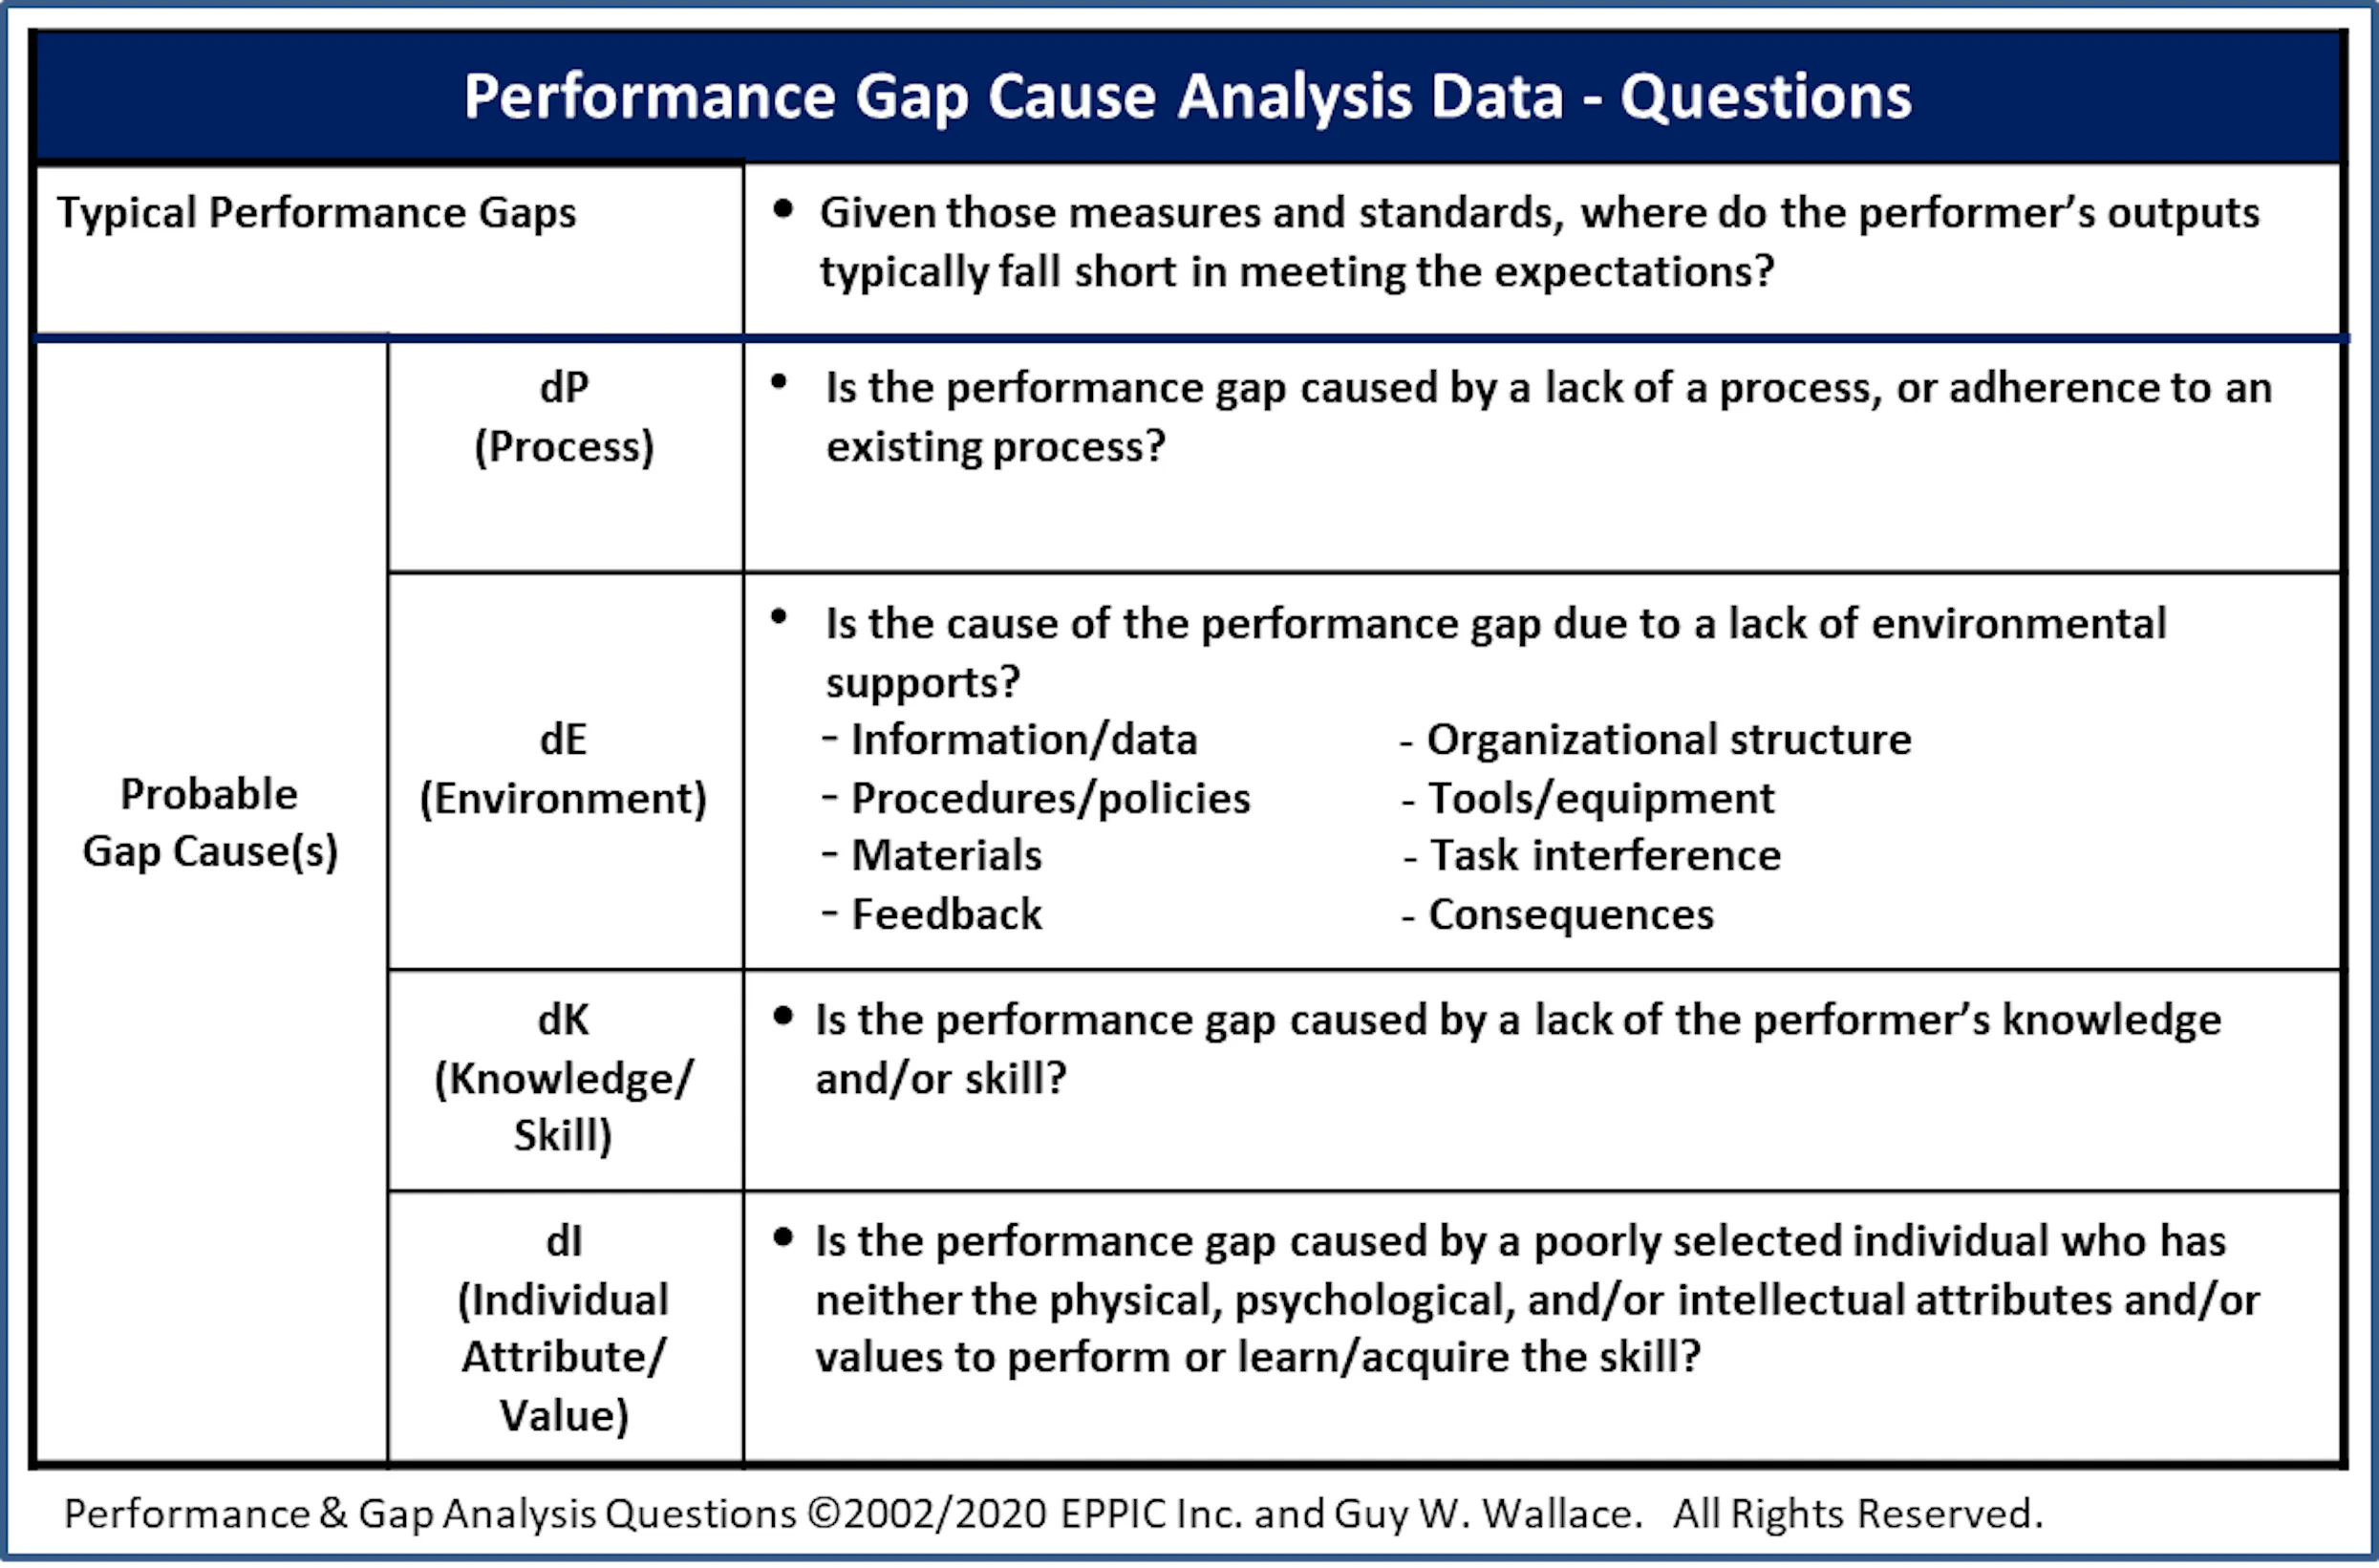
The Information in the right-half of a performance model captures and articulates actual performance of the non-master performers via a gap analysis and includes:
- Typical performance gaps—where standards for measures at any level are typically not being met by non-master performer job incumbents.
- Probable causes of those typical performance gaps.
- Differentiation of those probable causes into one or more of three categories of deficiency:
- dP: deficiency of the process itself.
- dE: deficiency of environmental supports.
- dK: deficiency of awareness, knowledge, and skills.
- dI: deficiency of Individual attributes and values.
The gap analysis is completed using some variation of these questions:
Again, I call these my starter questions. When I train others, I tell them that these are my questions and that they’ll have to come up with their own for use in the application exercises I use to provide them with practice with feedback. In my own projects, I discovered that it is critical to know how to elicit this data using a varied set of questions and not approach this in some rote manner. The data I’m after doesn’t change. Just the questions I use to elicit them.
Note: I do allow trainees to use my questions after they’ve created their own.
How to enable knowledge skills (K/Ss) categories and matrices
This analysis process should happen at the same time as the performance analysis efforts. This is for the sake of continuity and to avoid the impact of the participants’ forgetting curve.
The enabling knowledge/skills (K/Ss) are systematically derived using:
- The outputs, measures, tasks, roles, and responsibilities of ideal performance
- The gap analysis data.
The knowledge/skills are systematically derived using up to seventeen enabling knowledge/skills categories.
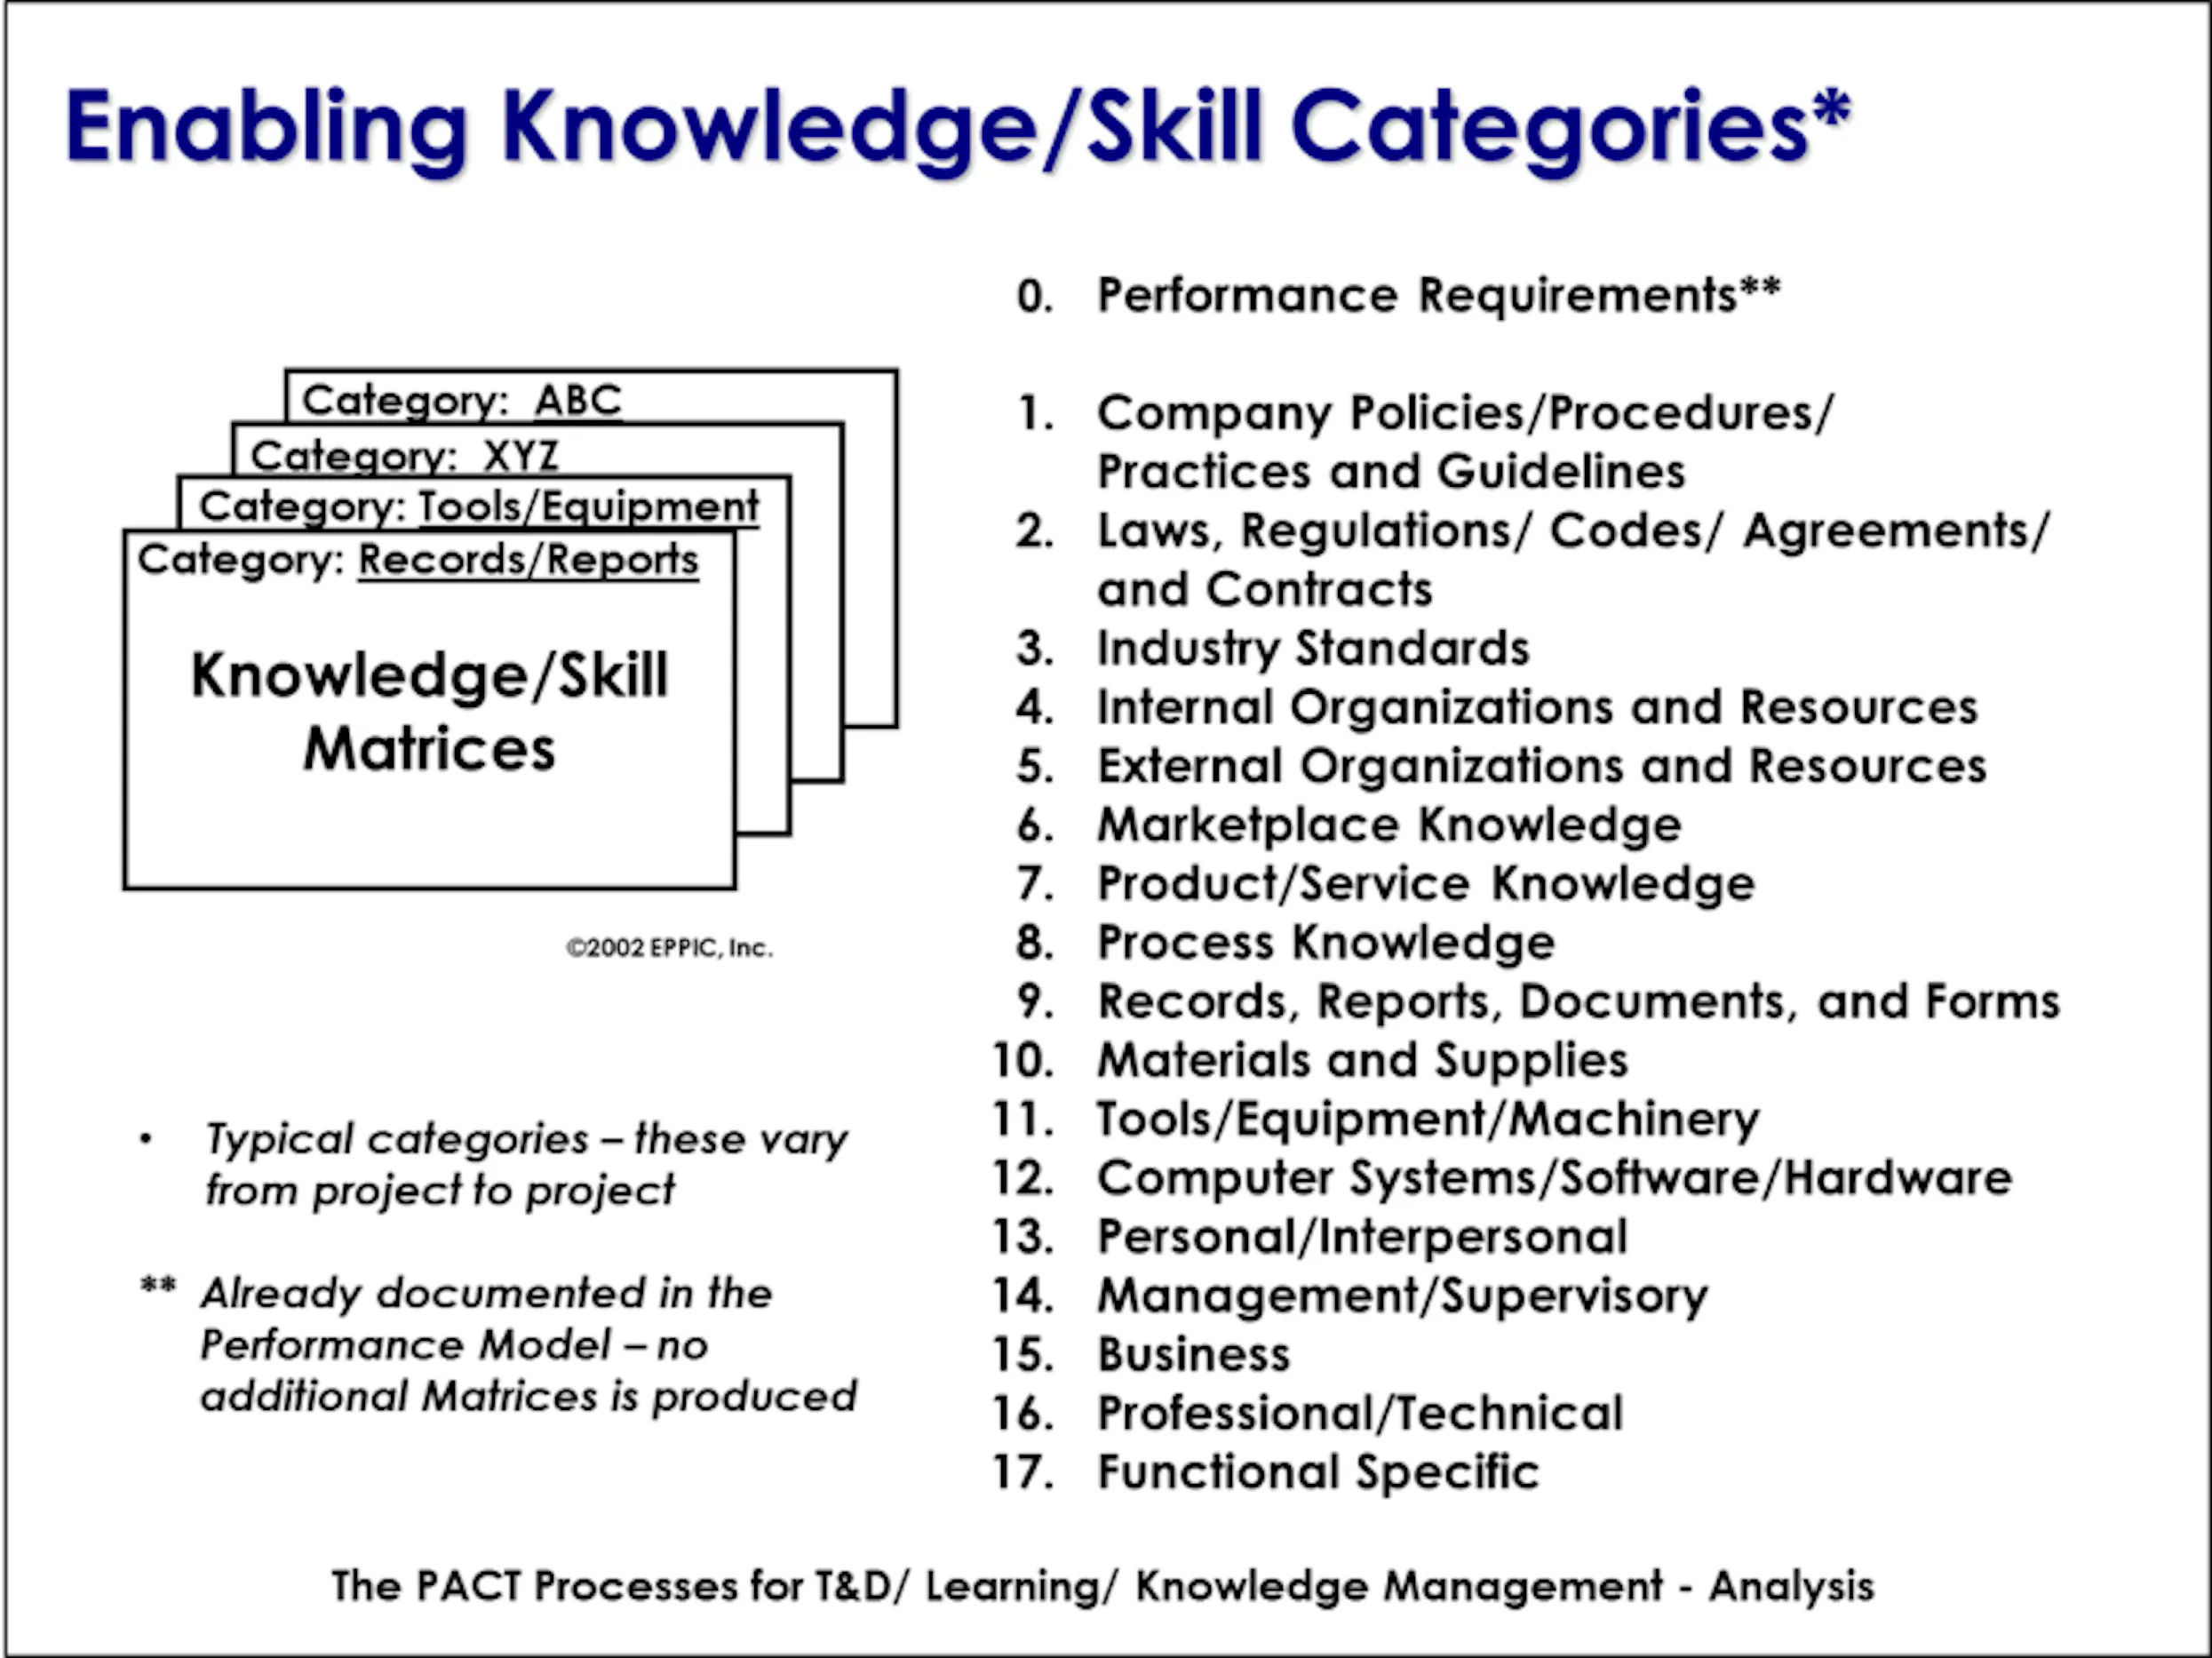
Before jumping in and systematically deriving the enabling knowledge/skill items, select the categories to be used. That selection typically happens with the project steering team and is then reviewed/modified during the kick-off meeting with the analysis team. I always ask the project steering team to empower the analysis team to review the selection and approve or modify them.
I have learned that master performers’ thoughts on what categories were appropriate to use sometimes differ from those that the project steering team had selected.
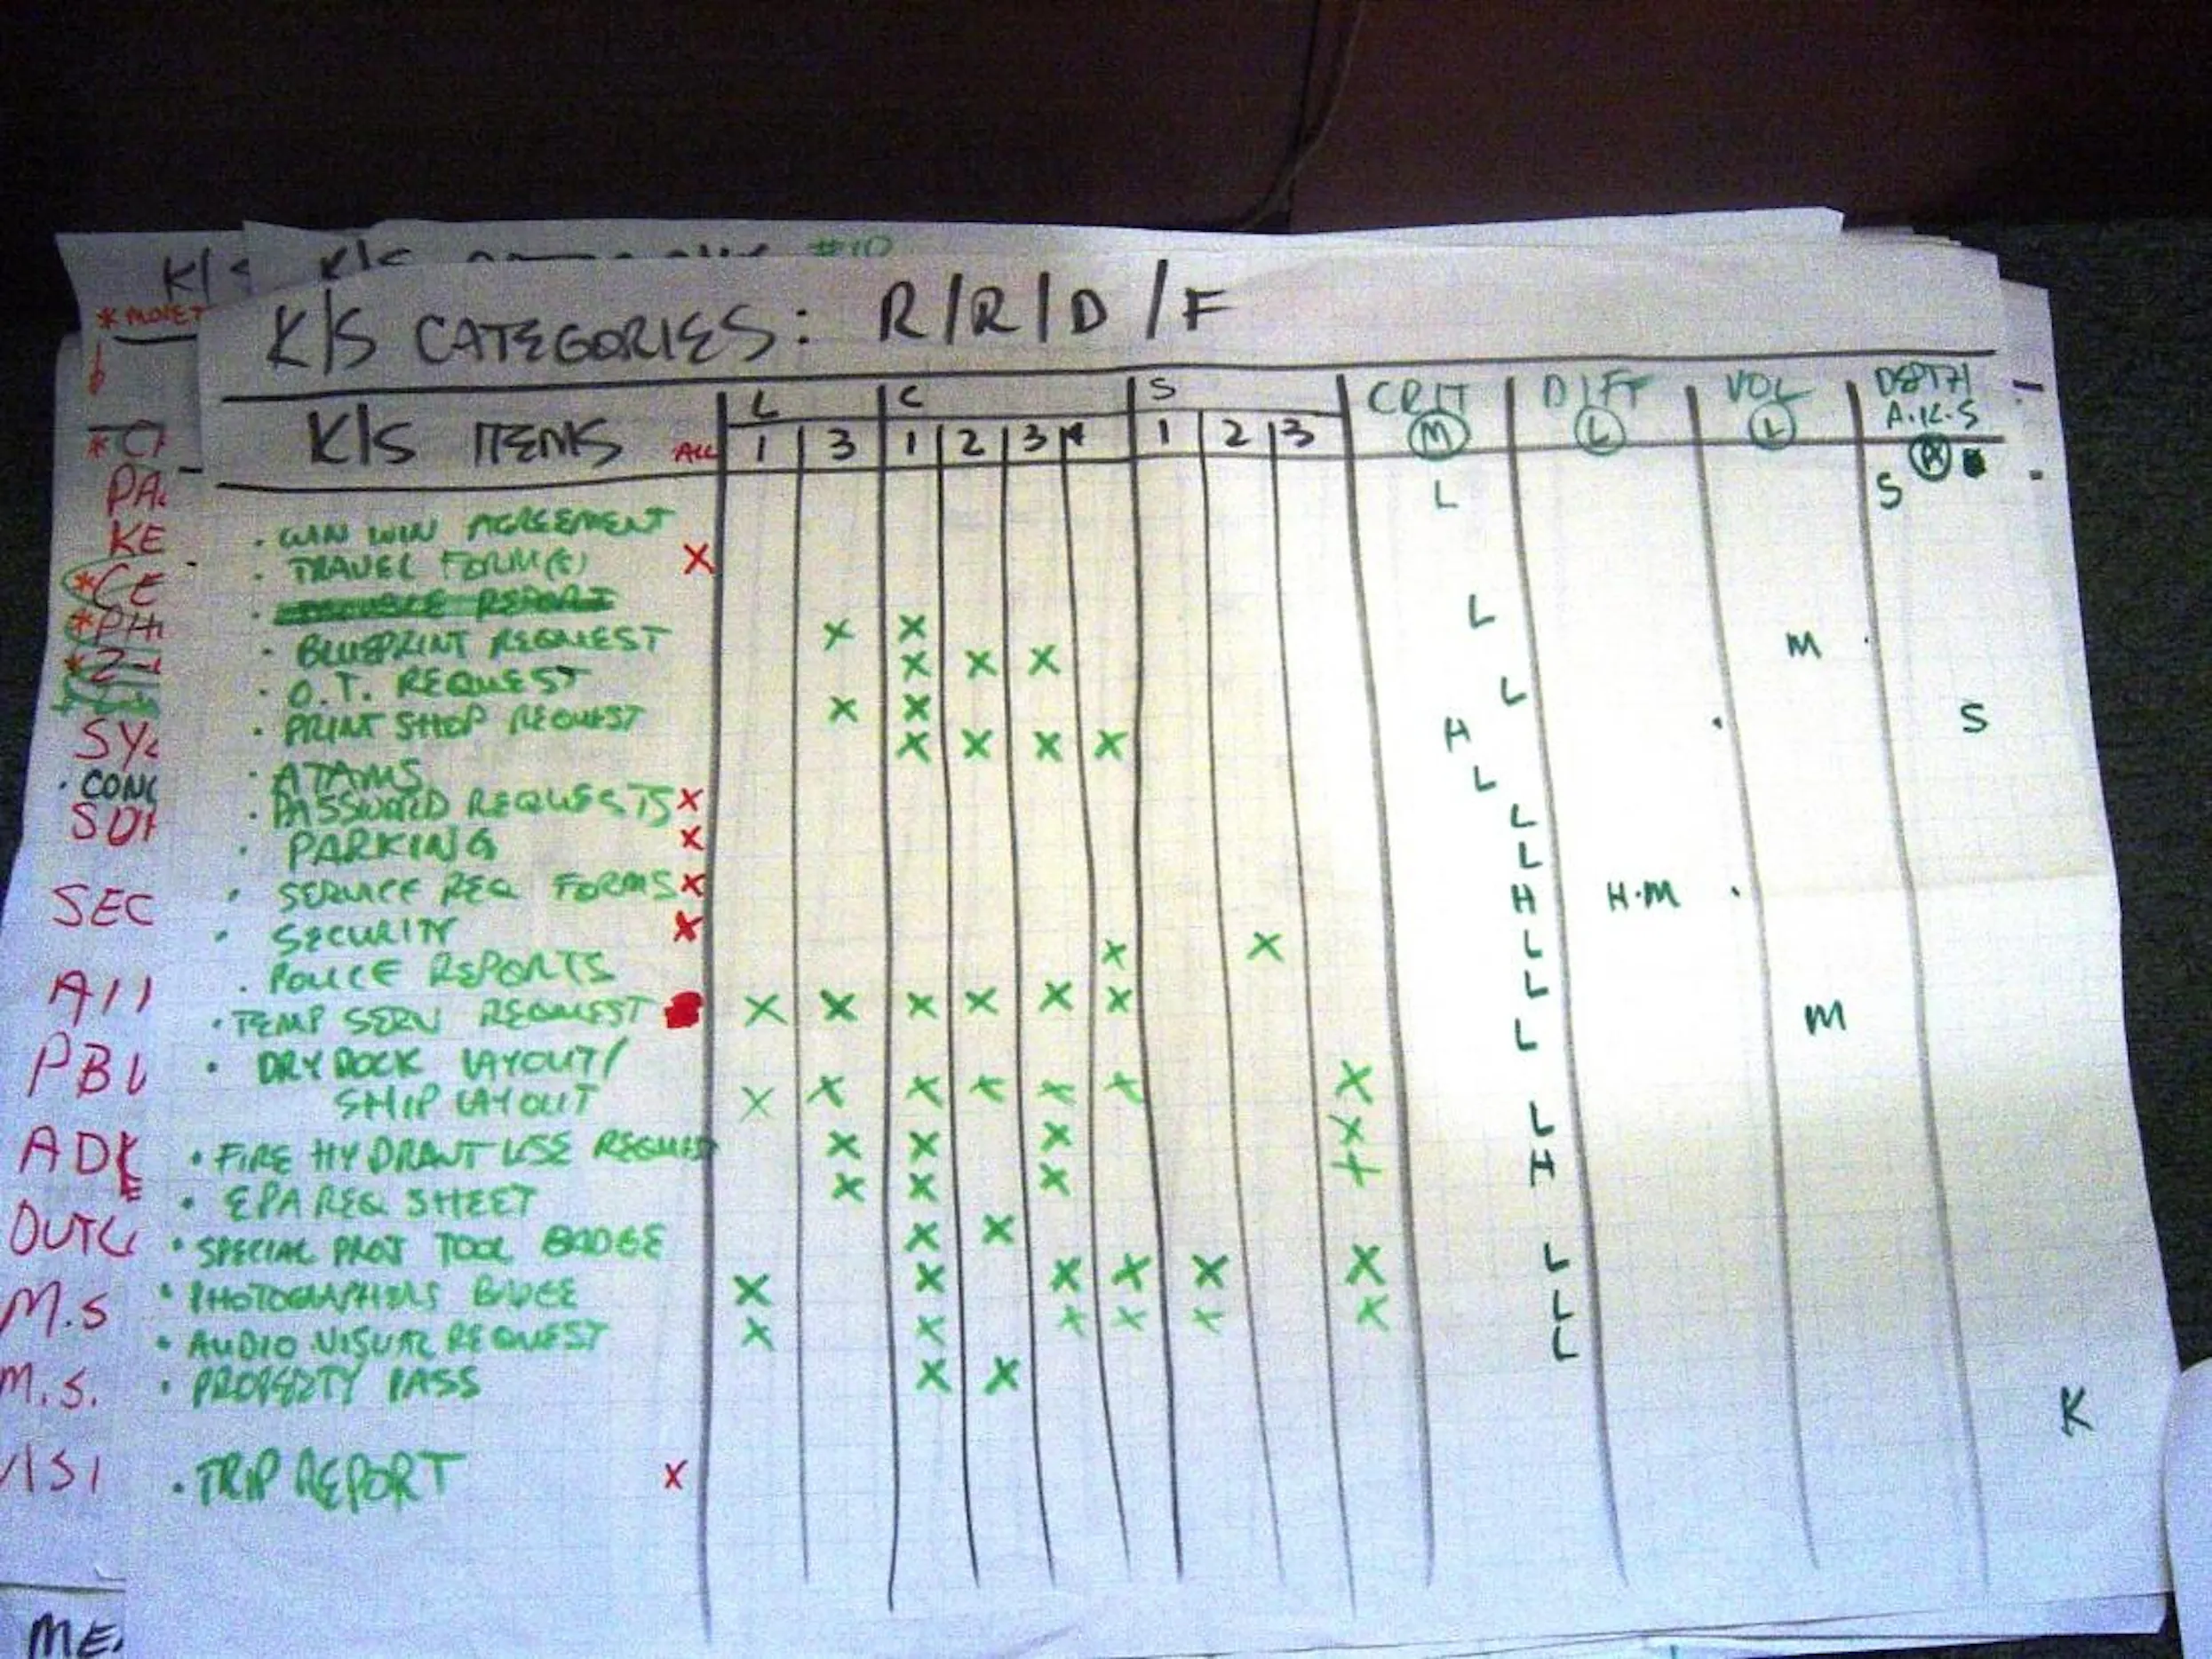
An example of the knowledge/skill analysis output, a knowledge/skill matrices, is shown below. There would be at least one matrix chart for each of the selected K/S categories appropriate to a project.
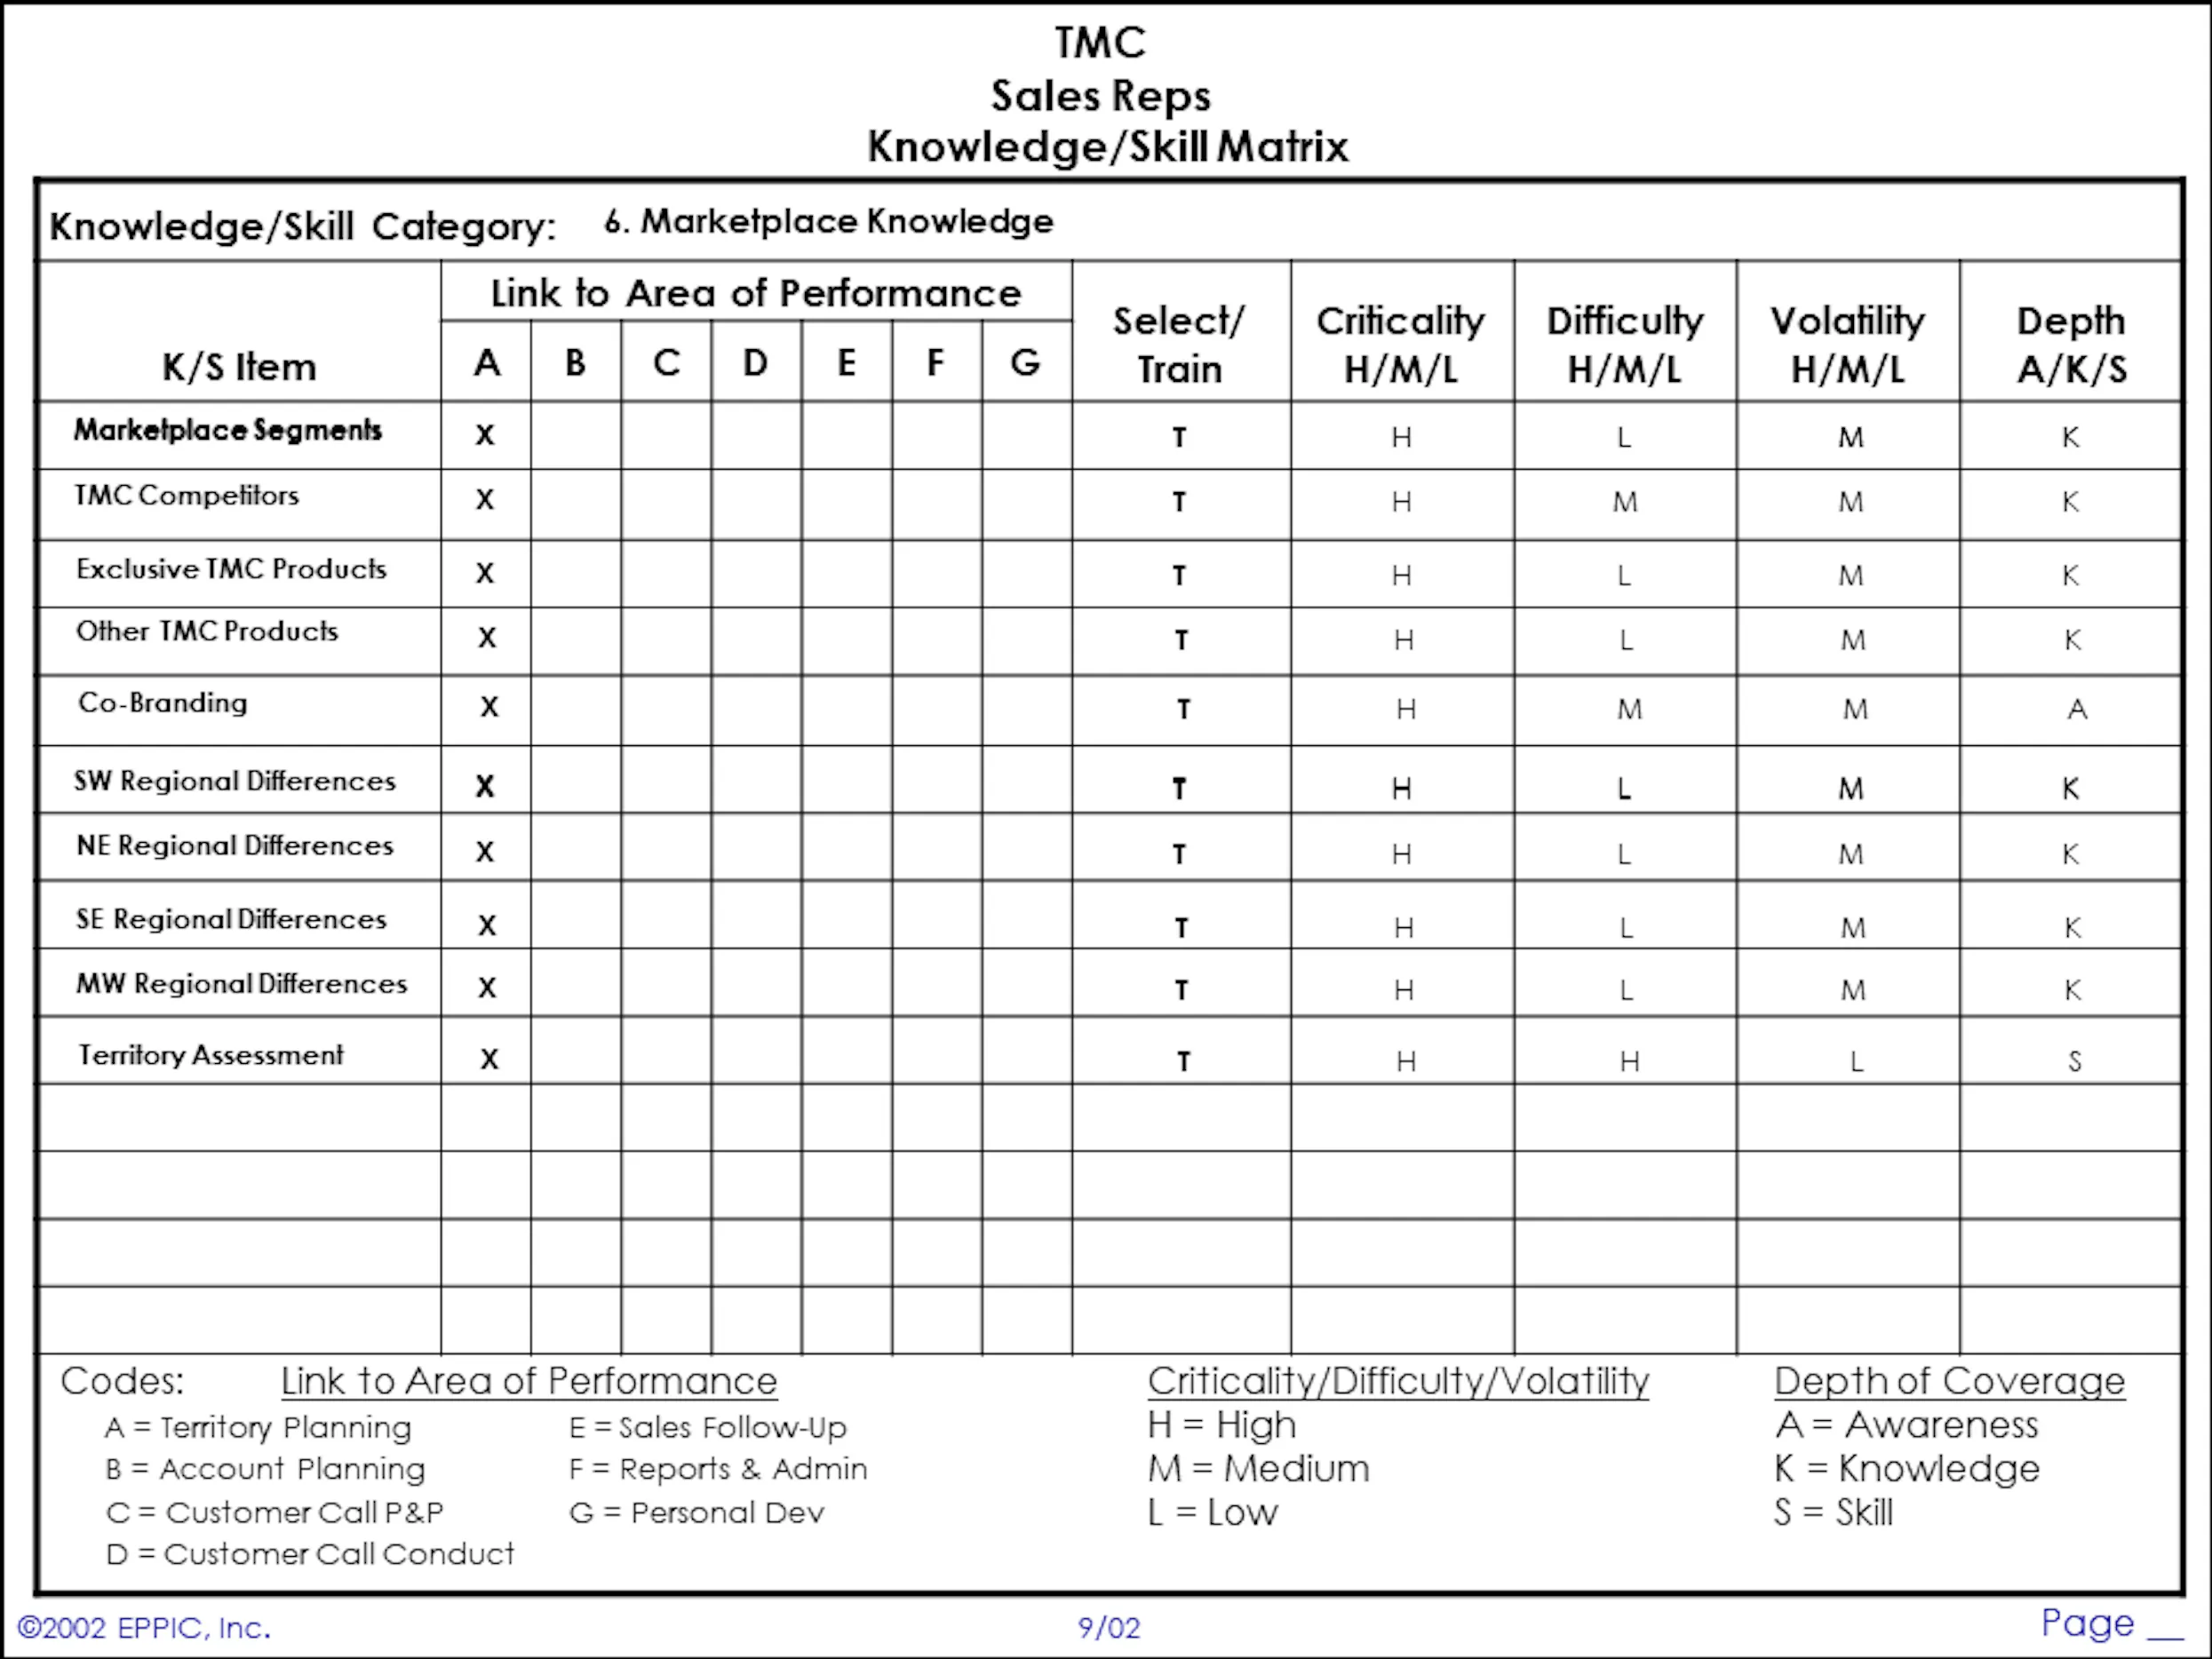
Note the link to the AoPs in the above example.
How to systematically derive knowledge/skill enablers (the first pass)
This process involves a systematic review of the performance model charts’ data just before systematically generating the enabling K/S items.
Have your source review the performance data on the first performance model chart for the first AoP.
Choose one knowledge/skill category and ask, “What knowledge/skill Items in this category enable that performance?”
List the answers in the K/S Item column on the far left.
Go to the next performance model chart and ask the same question. Repeat this process until you’ve covered every chart of the performance models for all AoPs for that knowledge/skill category.
Note: This review of the performance model data typically generates additional output, measures, or task data, as well as new gap data. Don’t go so fast during this part of the process that you miss the opportunities to make your performance data more complete.
Once you have covered every performance model chart in that category, go to the second knowledge/skill category and revisit each AoP’s outputs and tasks on the performance models charts again to elicit the knowledge/skill Items for the new category.
Again, when you revisit the performance data over and over again, new outputs, measures, and tasks almost always pop up. When it first happens, I communicate that this is what we want to happen to encourage those who might feel shy about adding to the data already captured.
I remind my colleagues of the non-conscious knowledge aspects of their individual and collective knowledge and whatever else I need to help them let go of that feeling. Why?
Managing master performers
Master performers don’t like the idea that the first time through this process, they were wrong or missed something. It is essential to make it okay for them to add to and modify the data that they generated.
Although extremely tedious, I have found that master performers generally like generating these complete lists of everything that a performer needs to know. Everything that they know.
And yet, it is still incomplete.
Use one knowledge/skill category at a time and add to the list of knowledge/skill Items on that chart (there are possibly multiple pages of knowledge/skill charts per category) as you review each of the performance model charts over and over again.
For example, if you used all seventeen knowledge/skill categories (a rare occurrence), you would have revisited the performance model chart data seventeen times. And you would have likely added to or otherwise modified that performance data a dozen times or more.
Depending on the scope of the performance to be analyzed, there might be hundreds of knowledge/skill Items documented that enable performance.
One of my most significant efforts in one project generated over 1,200 knowledge/skill Items. That was an analysis of two job titles, done for the Production Supervisors and Zone Managers at the Norfolk Naval Shipyard in 2003 for an instructional architecture effort.
Most instructional development efforts focus on something smaller than an entire job. Smaller projects might only generate 75-100 K/S items or less.
In summary, to complete the enabler matrices’ left-hand columns, identify the individual enabler items, one at a time, via a systematic review of each page of the performance model.
Then, list them on an enabler matrices chart and link each enabler item back to one or more of the AoPs that it enables. The rest of the columns are left blank until a second pass is made when additional data are gathered for each enabler item on the matrices.
Those five right-hand side columns are covered next.
How to complete the knowledge/skill matrices (the second pass)
The second pass at the knowledge/skill matrices gives the analysis team yet another chance to add to or modify three areas when they complete the data on the right-hand side of the matrices. A second review recalls additional data that makes the following data more complete:
- Enabling knowledge/skill items.
- Performance model chart data regarding outputs, measures, and tasks.
- Performance gaps.
The analyst marks each K/S item with the appropriate letter for each of the following columns on the right-hand side of the K/S matrices.
Select/Train
This differentiates those items on the human asset enabler matrices that are attended to (if indeed they truly are) by the selection process and do not need to be addressed by the training process.
Criticality
This field documents an assessment of the importance of the enabler item to the performance that it enables.
Difficulty
This indicates how difficult the analysis team assesses it will be for the typical target audience member to grasp the awareness, knowledge, or skill related to this enabler item.
Volatility
This field is an assessment of the amount of maintenance required by the content covering the enabler item. Volatility impacts packaging and deployment/distribution strategies for the enabler.
Depth
This last field indicates the relative depth of coverage that any instruction needs to provide.
The Information captured on the right-hand column influences the design in the next phase of an instructional development effort.
To help you put these instructions into practice, I’ve included two example performance model charts and K/S matrices to help illustrate.
Example performance model chart and K/S matrices
Here are examples from a project I did in 2003 for Production Supervisors and Zone Managers at the Norfolk Naval Shipyard. The K/S category is records, reports, documents, and forms.
These two sets of instructional analysis data are critical to defining the performance competence requirements of the learners, as well as determining what knowledge/skills they need in order to be competent.
This analysis data is then used in my instructional design methods for instructional design, which includes both performance support and learning experiences. Hopefully at this stage, you’ve learned how to complete your own learner needs analysis in an enterprise context and can personalize the process to your organization.
 Our weekly newsletter of the best insights from L&D peer to L&D peer.
By providing your contact info, you agree to receive communications from 360Learning. You can opt-out at any time. For details, refer to our Privacy Policy.